Backtesting in TradingView charts. Replay the market, take trades as if they were live, and see how your strategy would have performed in the past.Backtesting in TradingView charts. Replay the market,take trades as if they were live, and see how yourstrategy would have performed in the past.
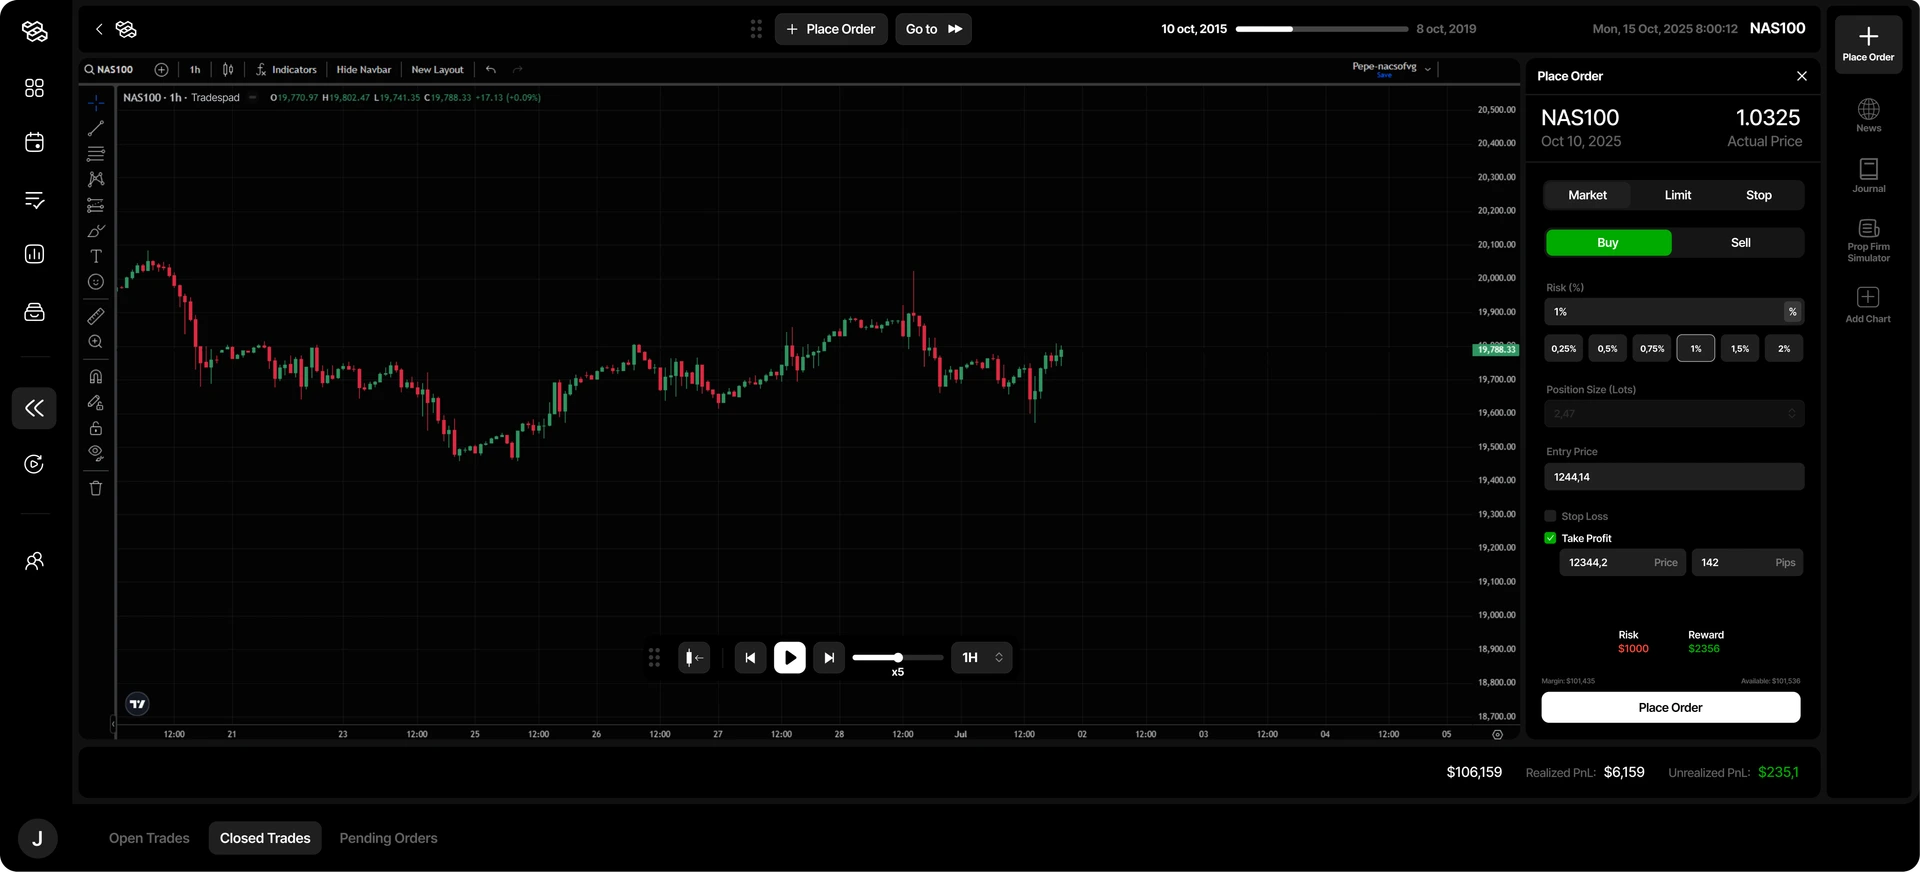
Go back in time with Tradespad.The #1 backtesting software.
Start for free
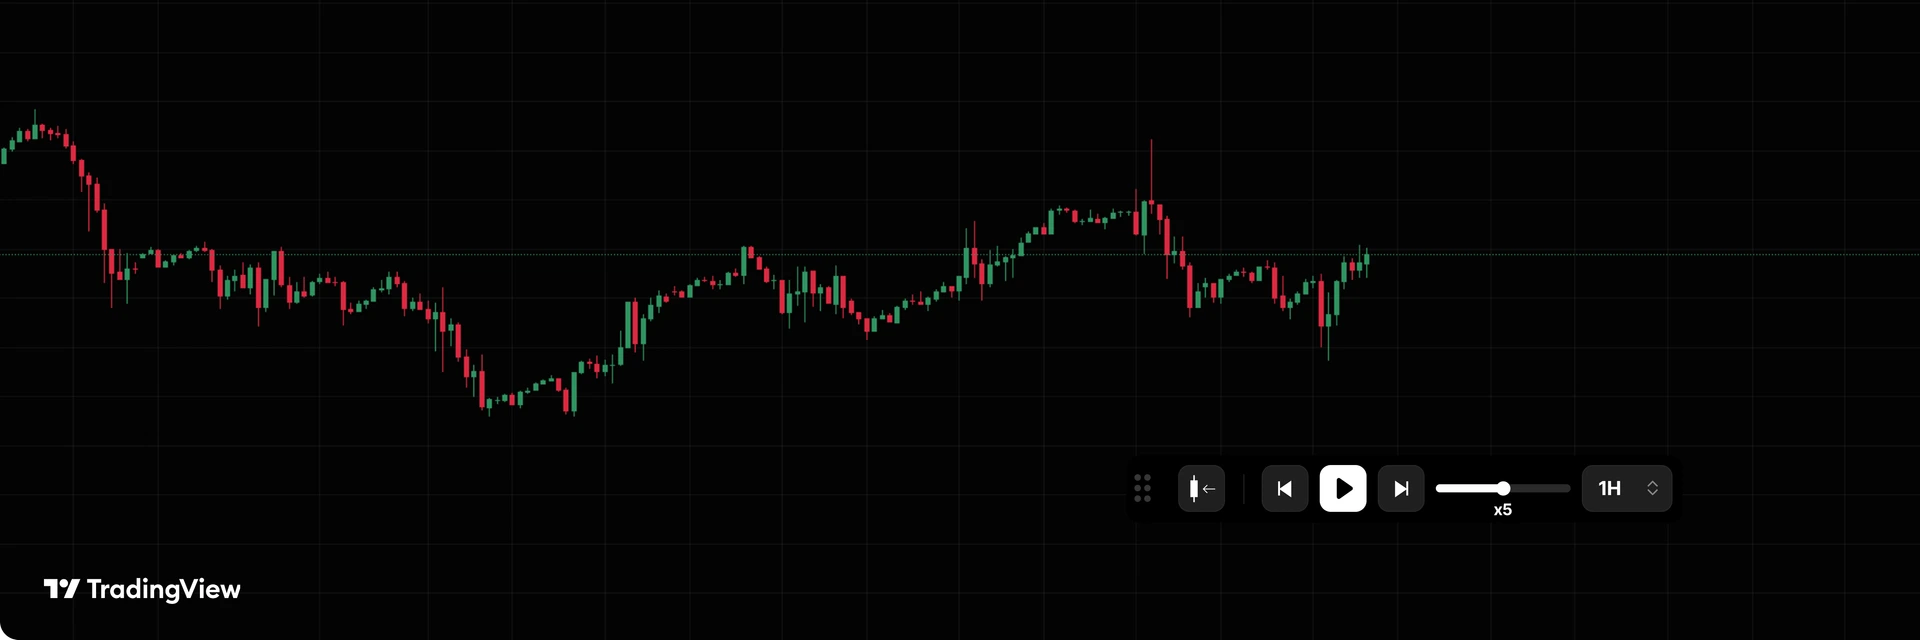
Using TradingView charts for the most realistic experience
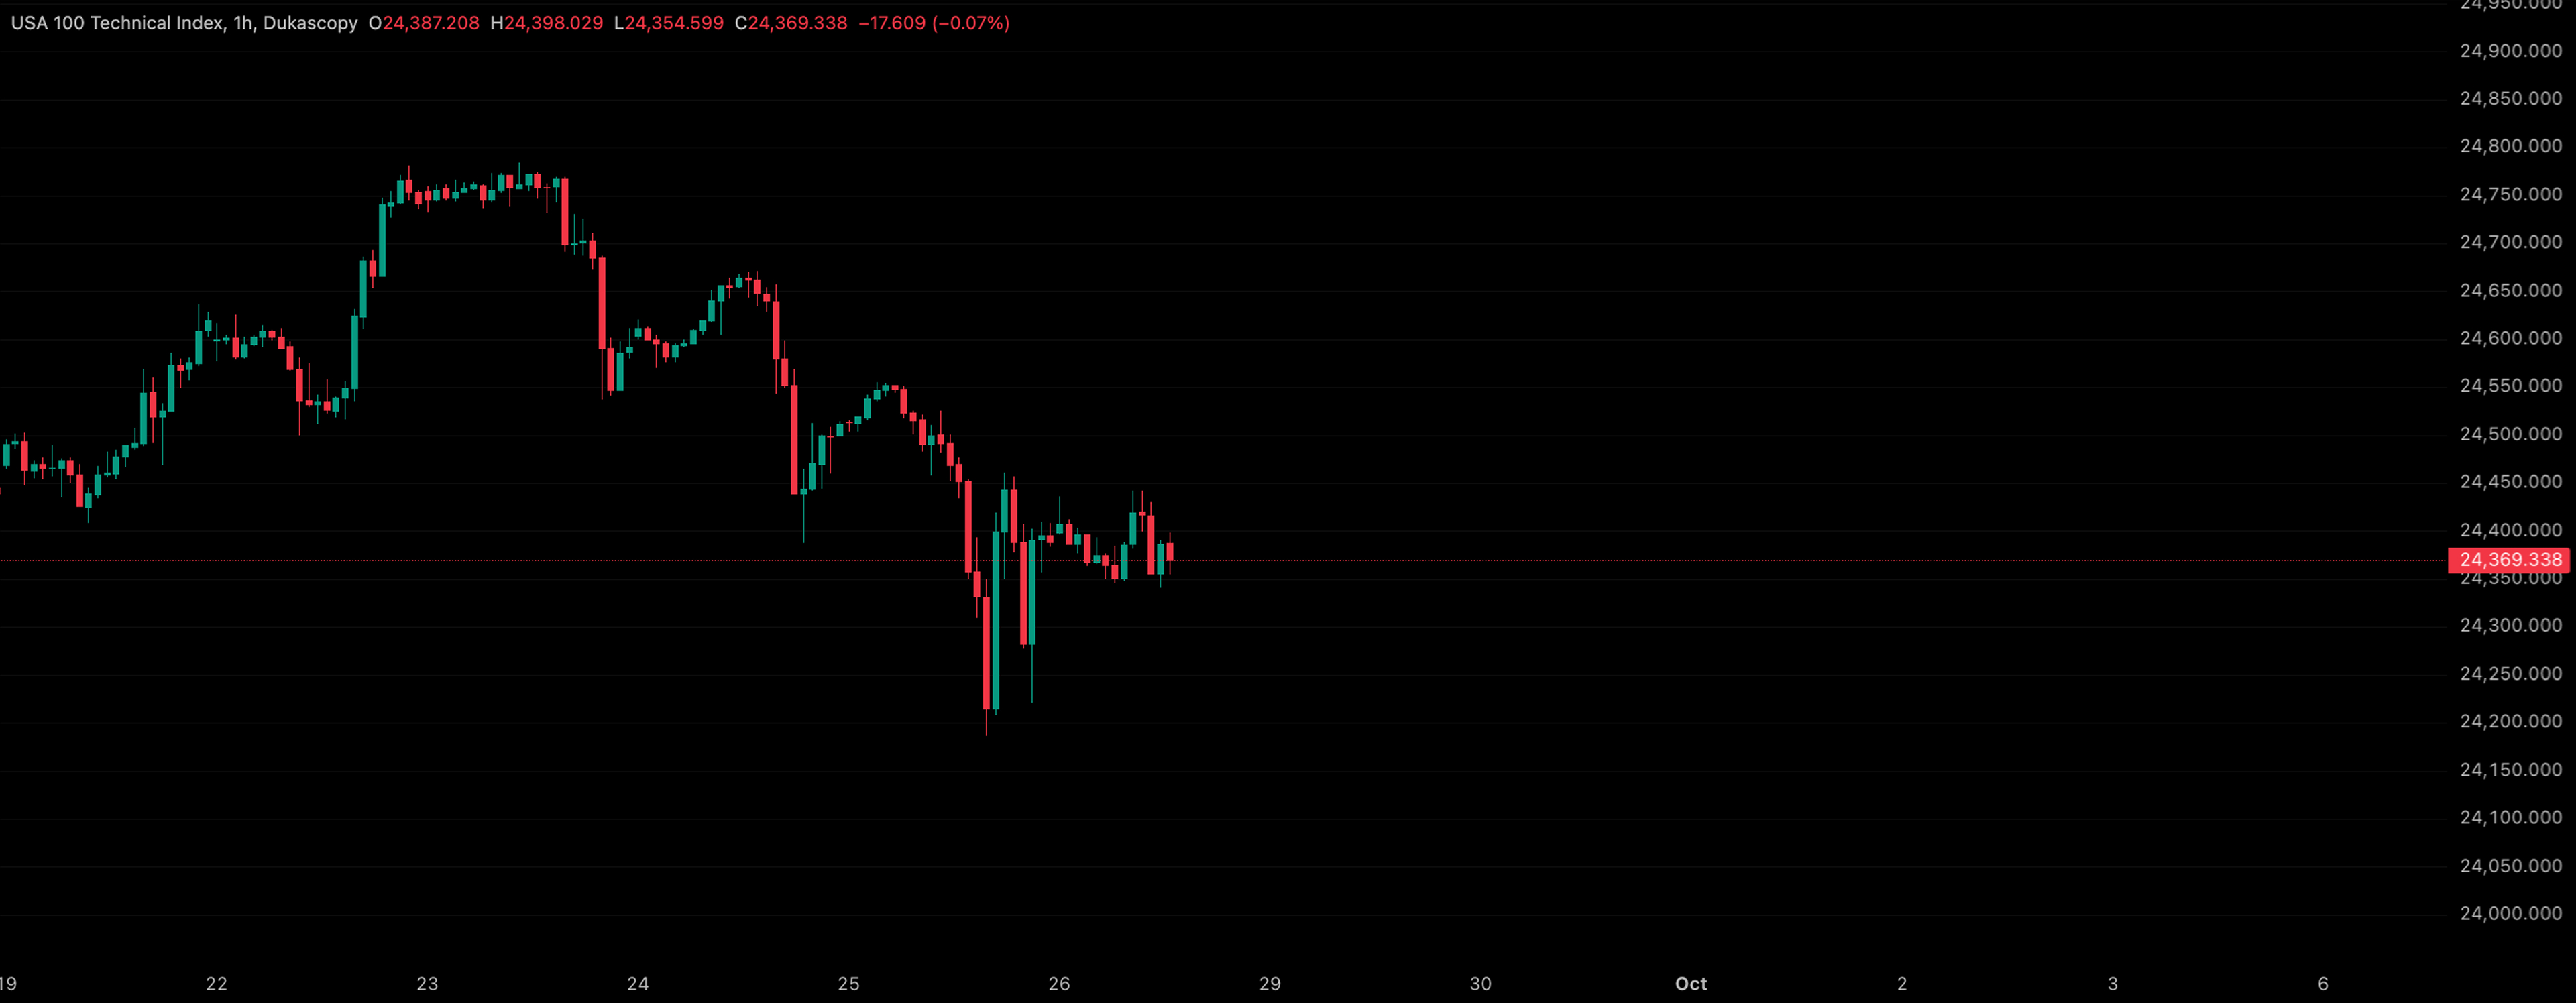
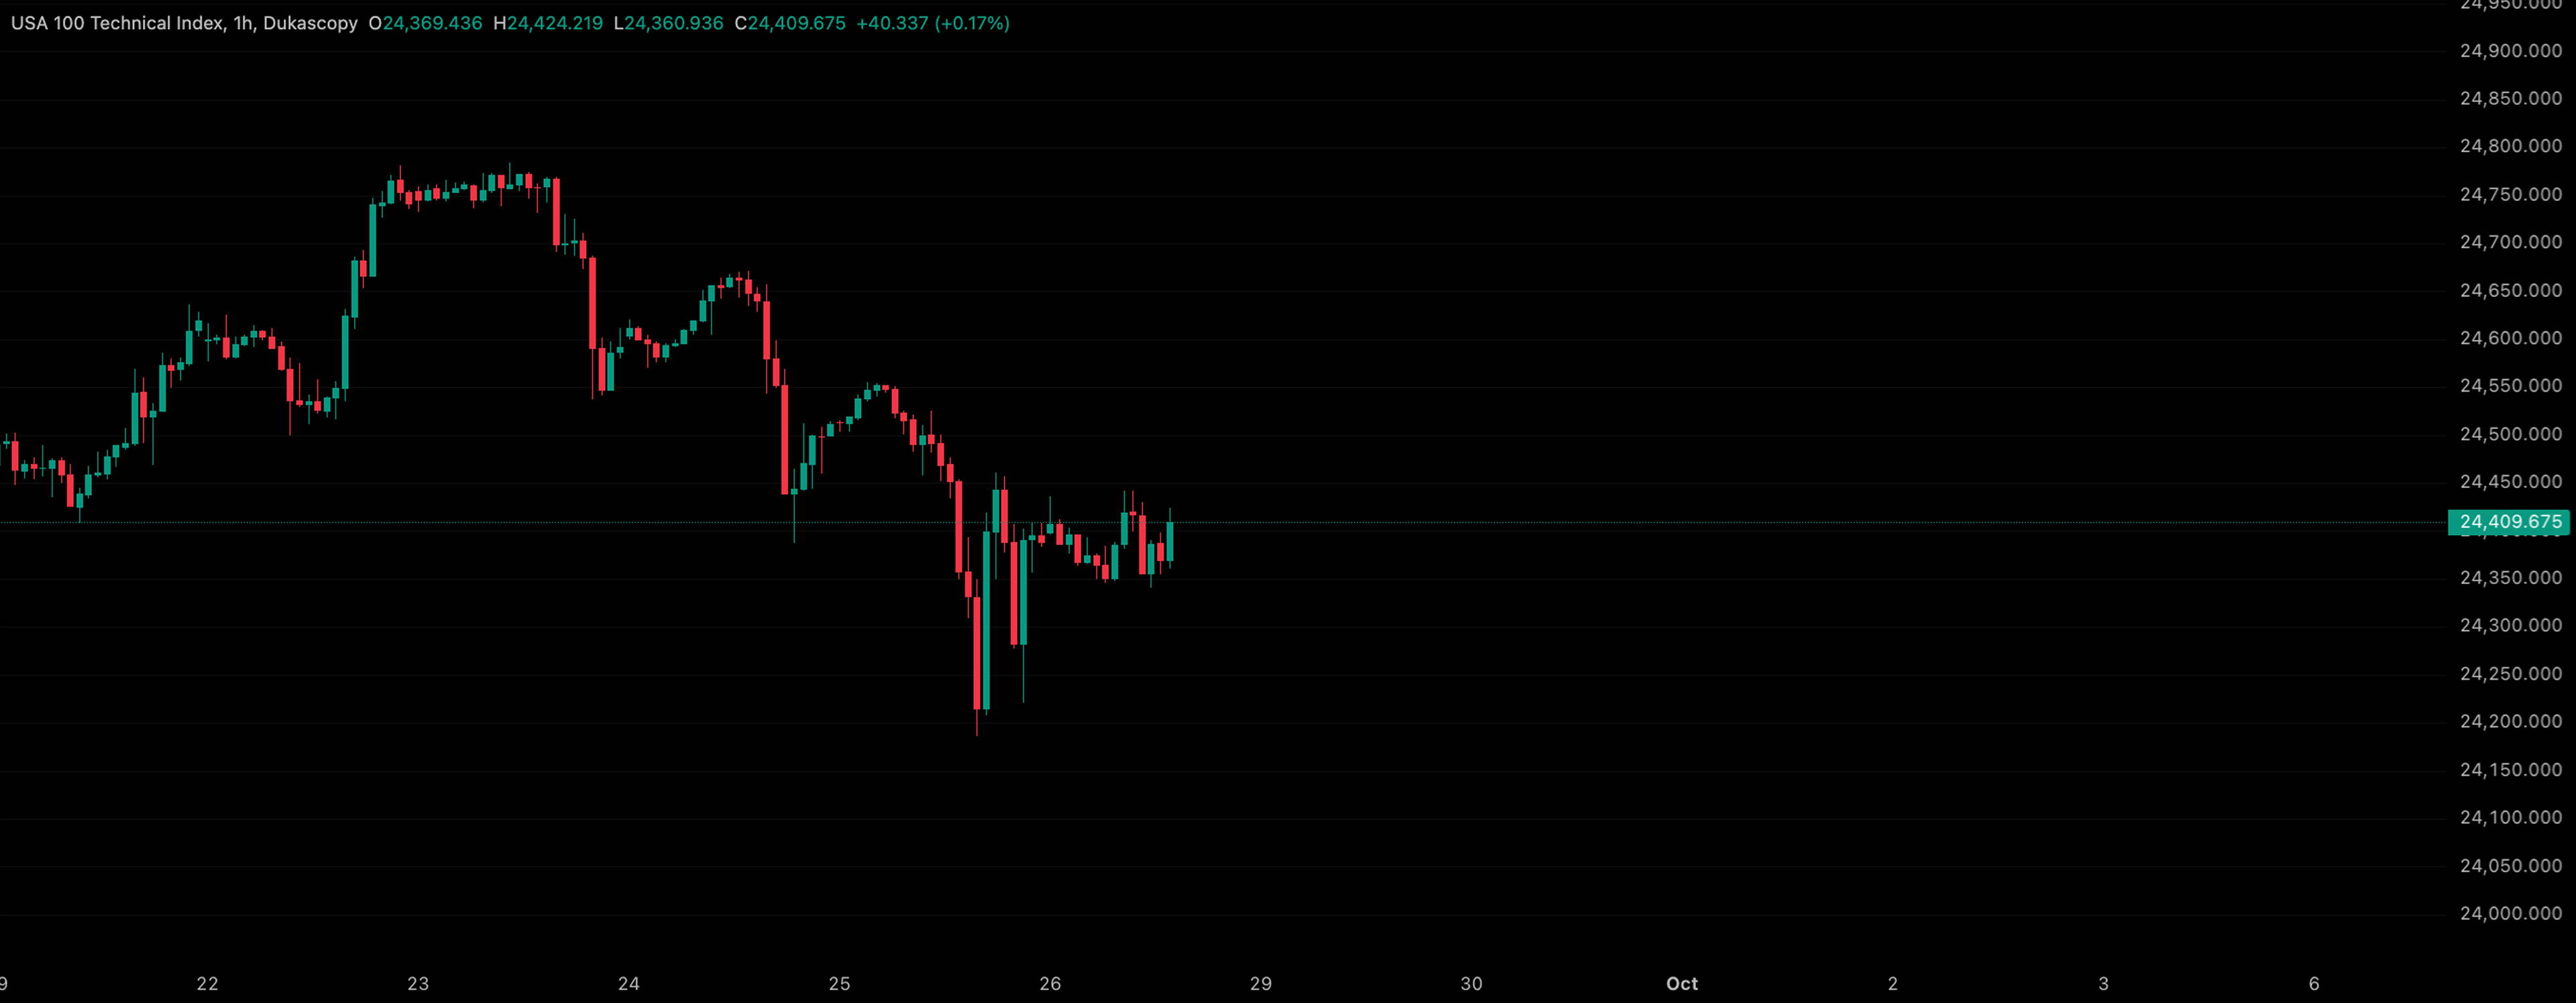
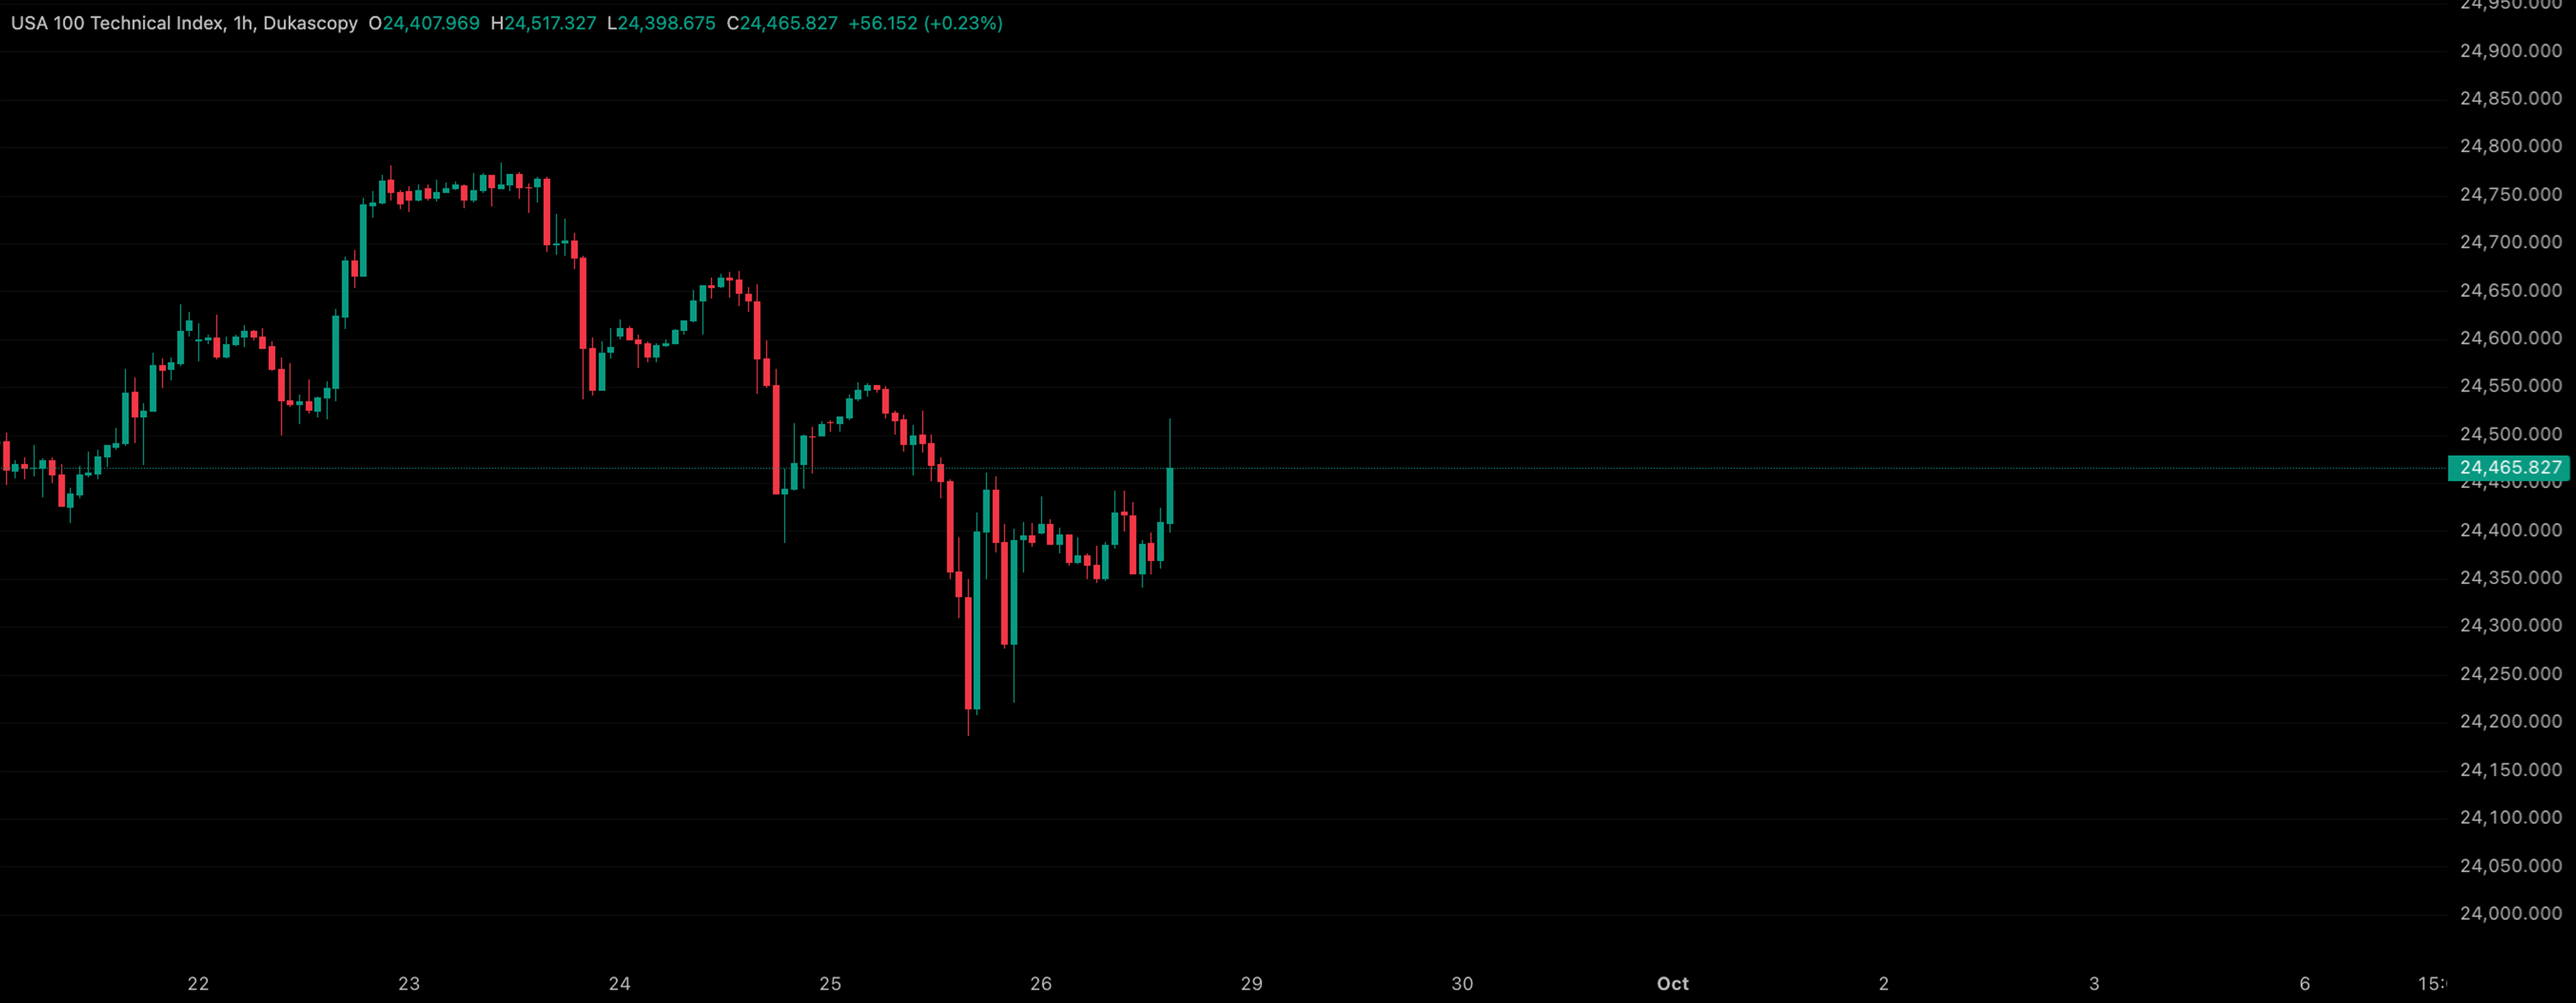
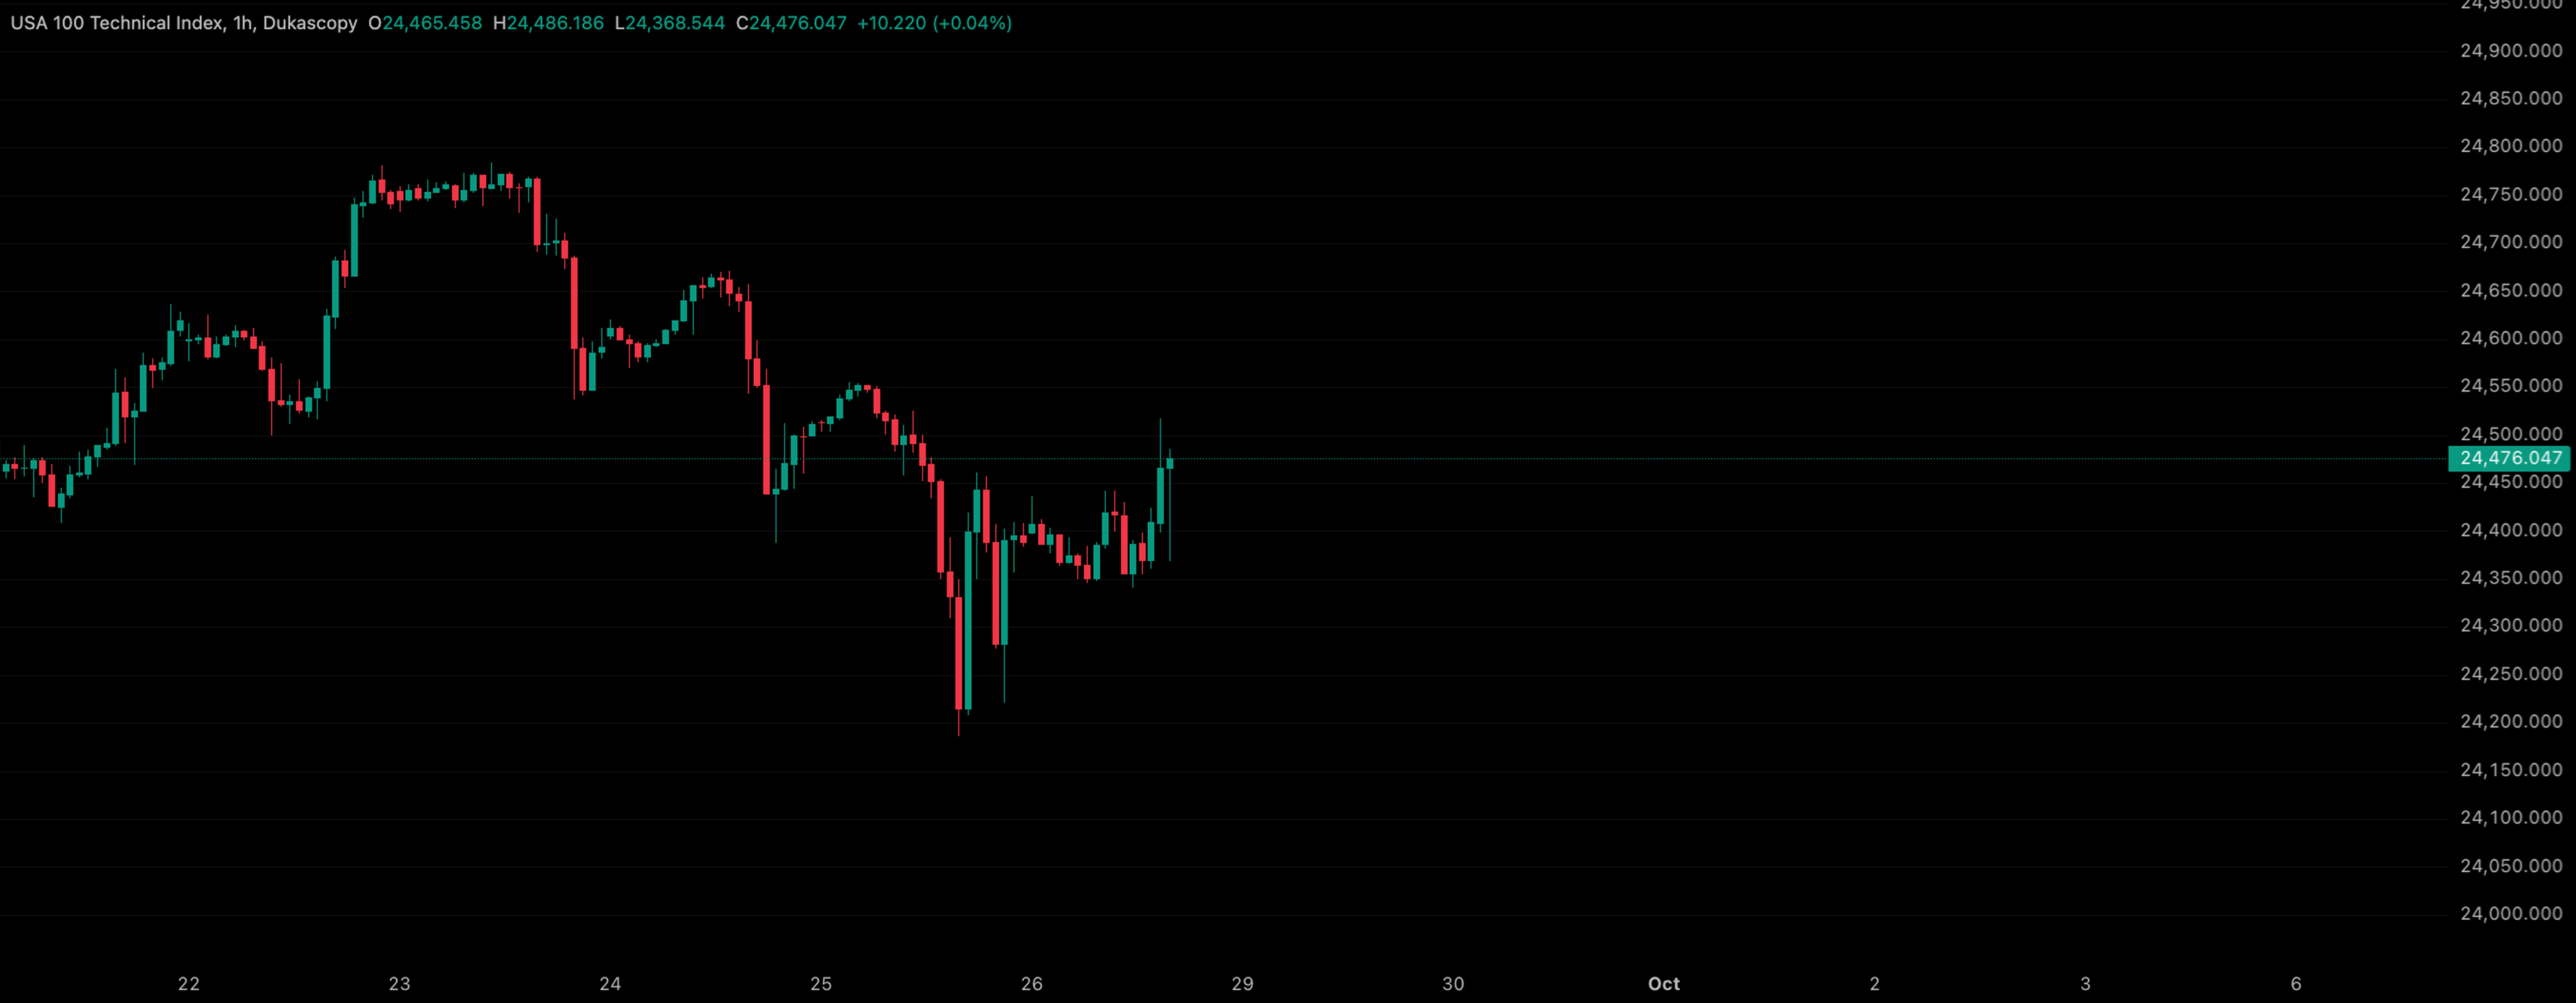
Use familiar TradingView charts to replay the market, place trades, and test your strategy in a simulated environment as if you were trading the live market.
 NAS100Nasdaq Inc.4.745 days29,103.08
 SP500S&P 500 Index4.745 days7,640.06
 XAU/USDGold vs Dollar7.304 days4,342.79
 BTC/USDBitcoin vs Dollar7.304 days77,401
 GBP/USDPound vs Dollar7.304 days1.3514
 EUR/USDEuro vs Dollar7.304 days1.1588

Backtest forex, crypto, indices, commodities and more.
Test your trading strategies across 30+ assets, analyze your results, and find out which setups actually have an edge.
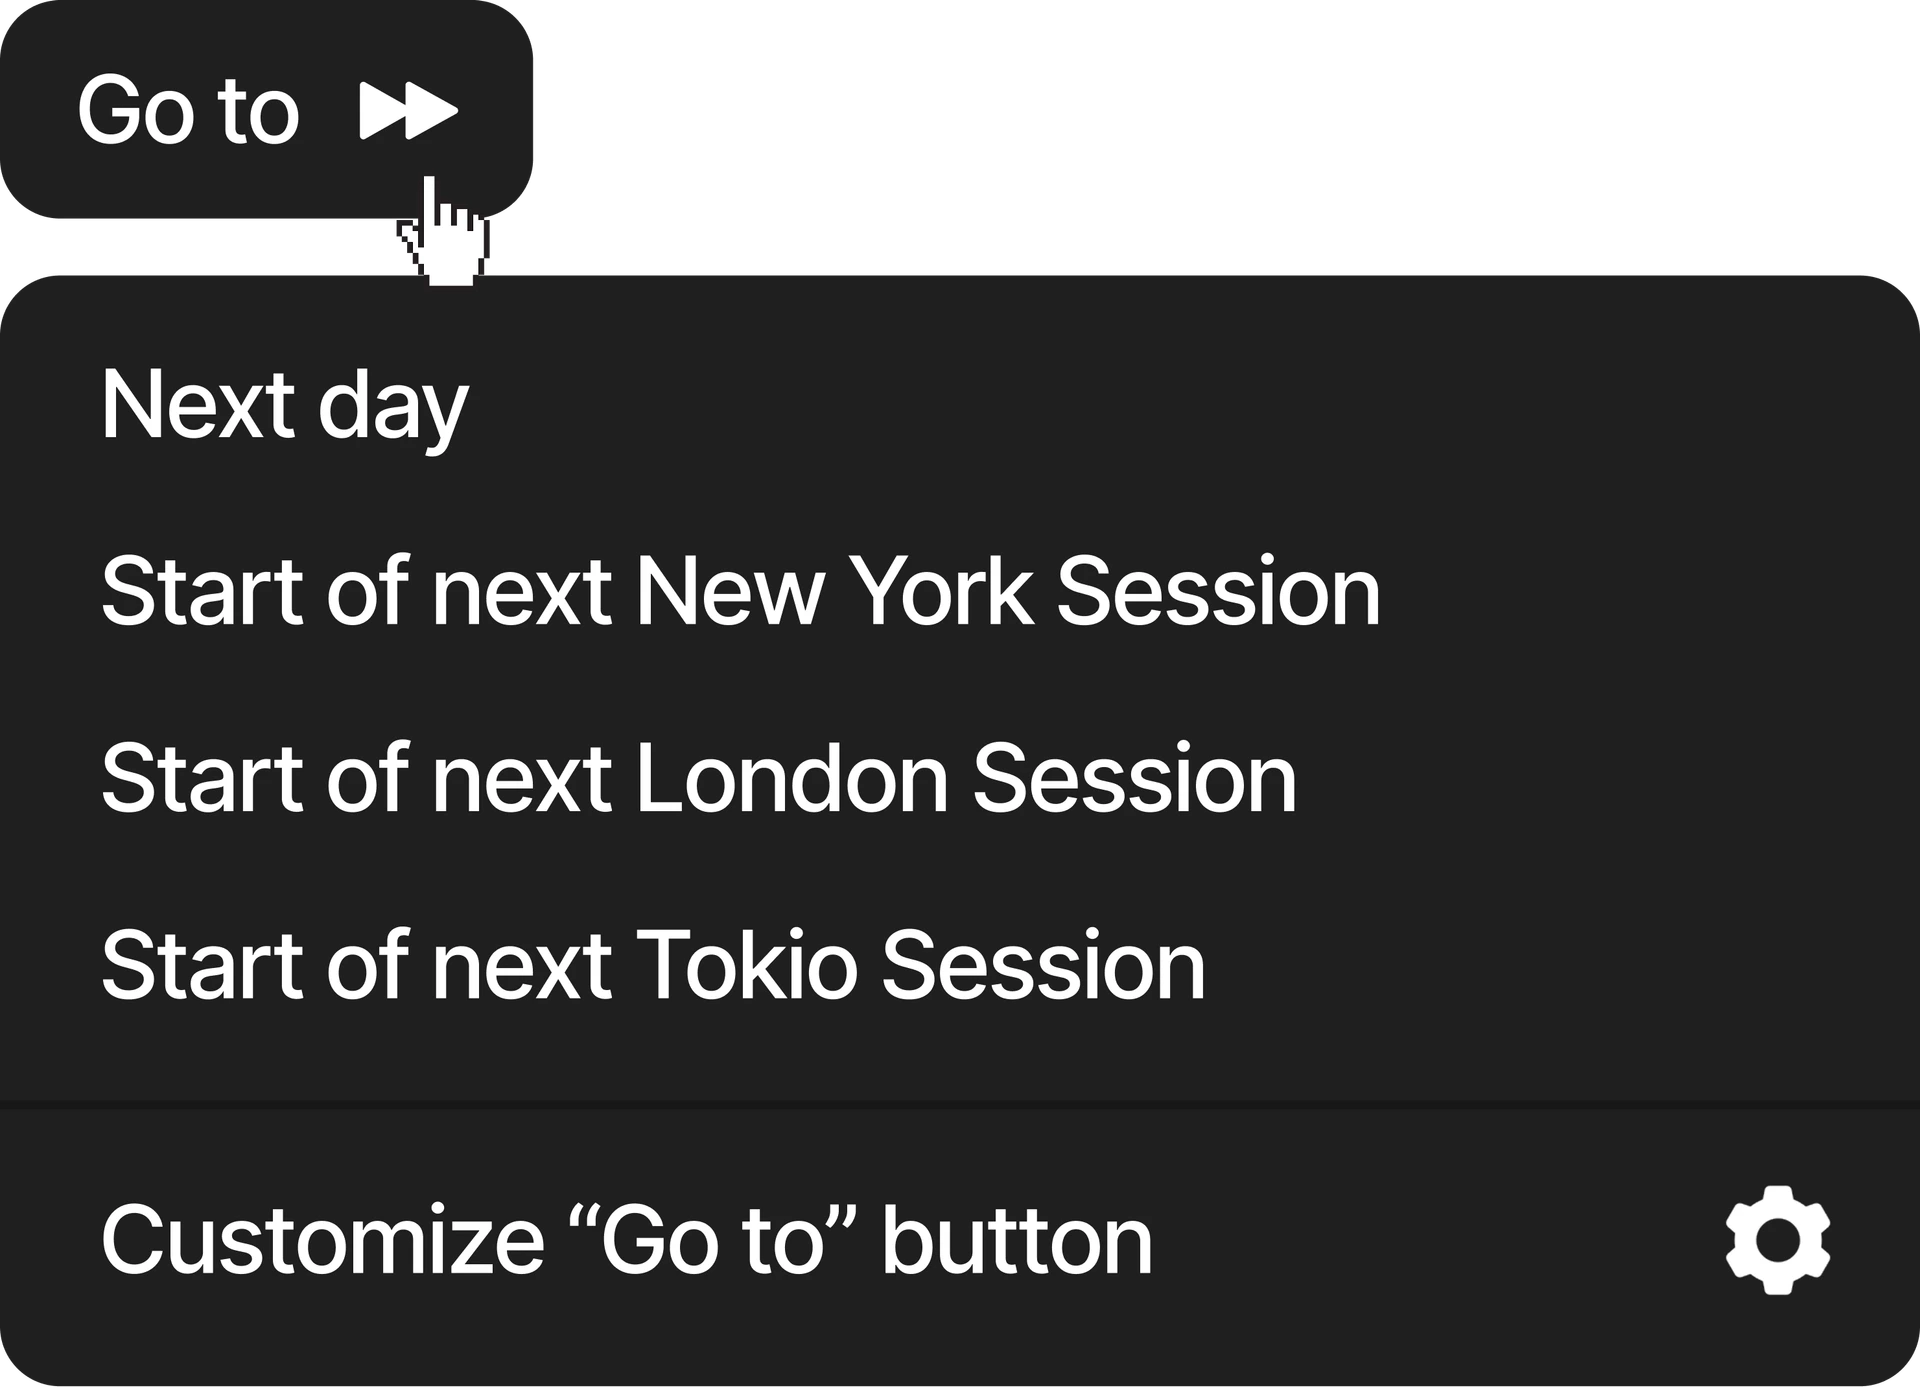
Go to button
Automatically go to the next day/session or create custom values.
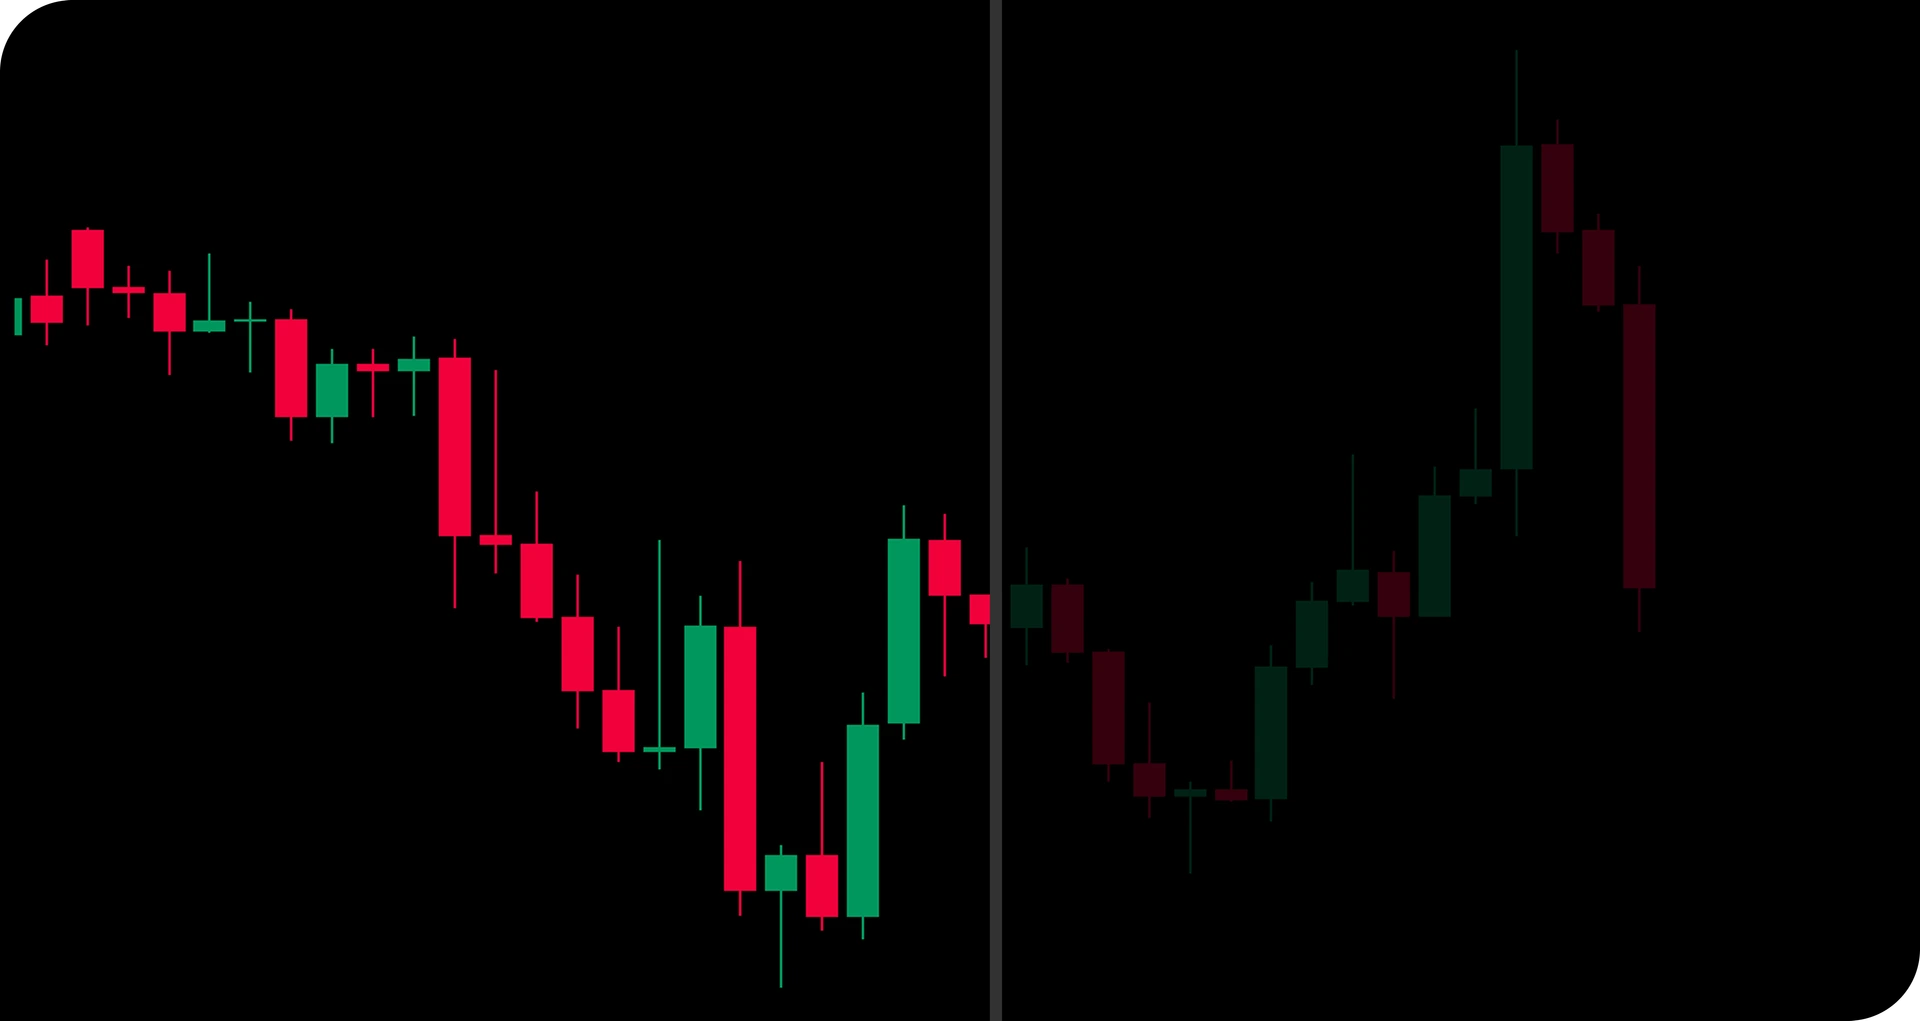
+24 years of market data available.
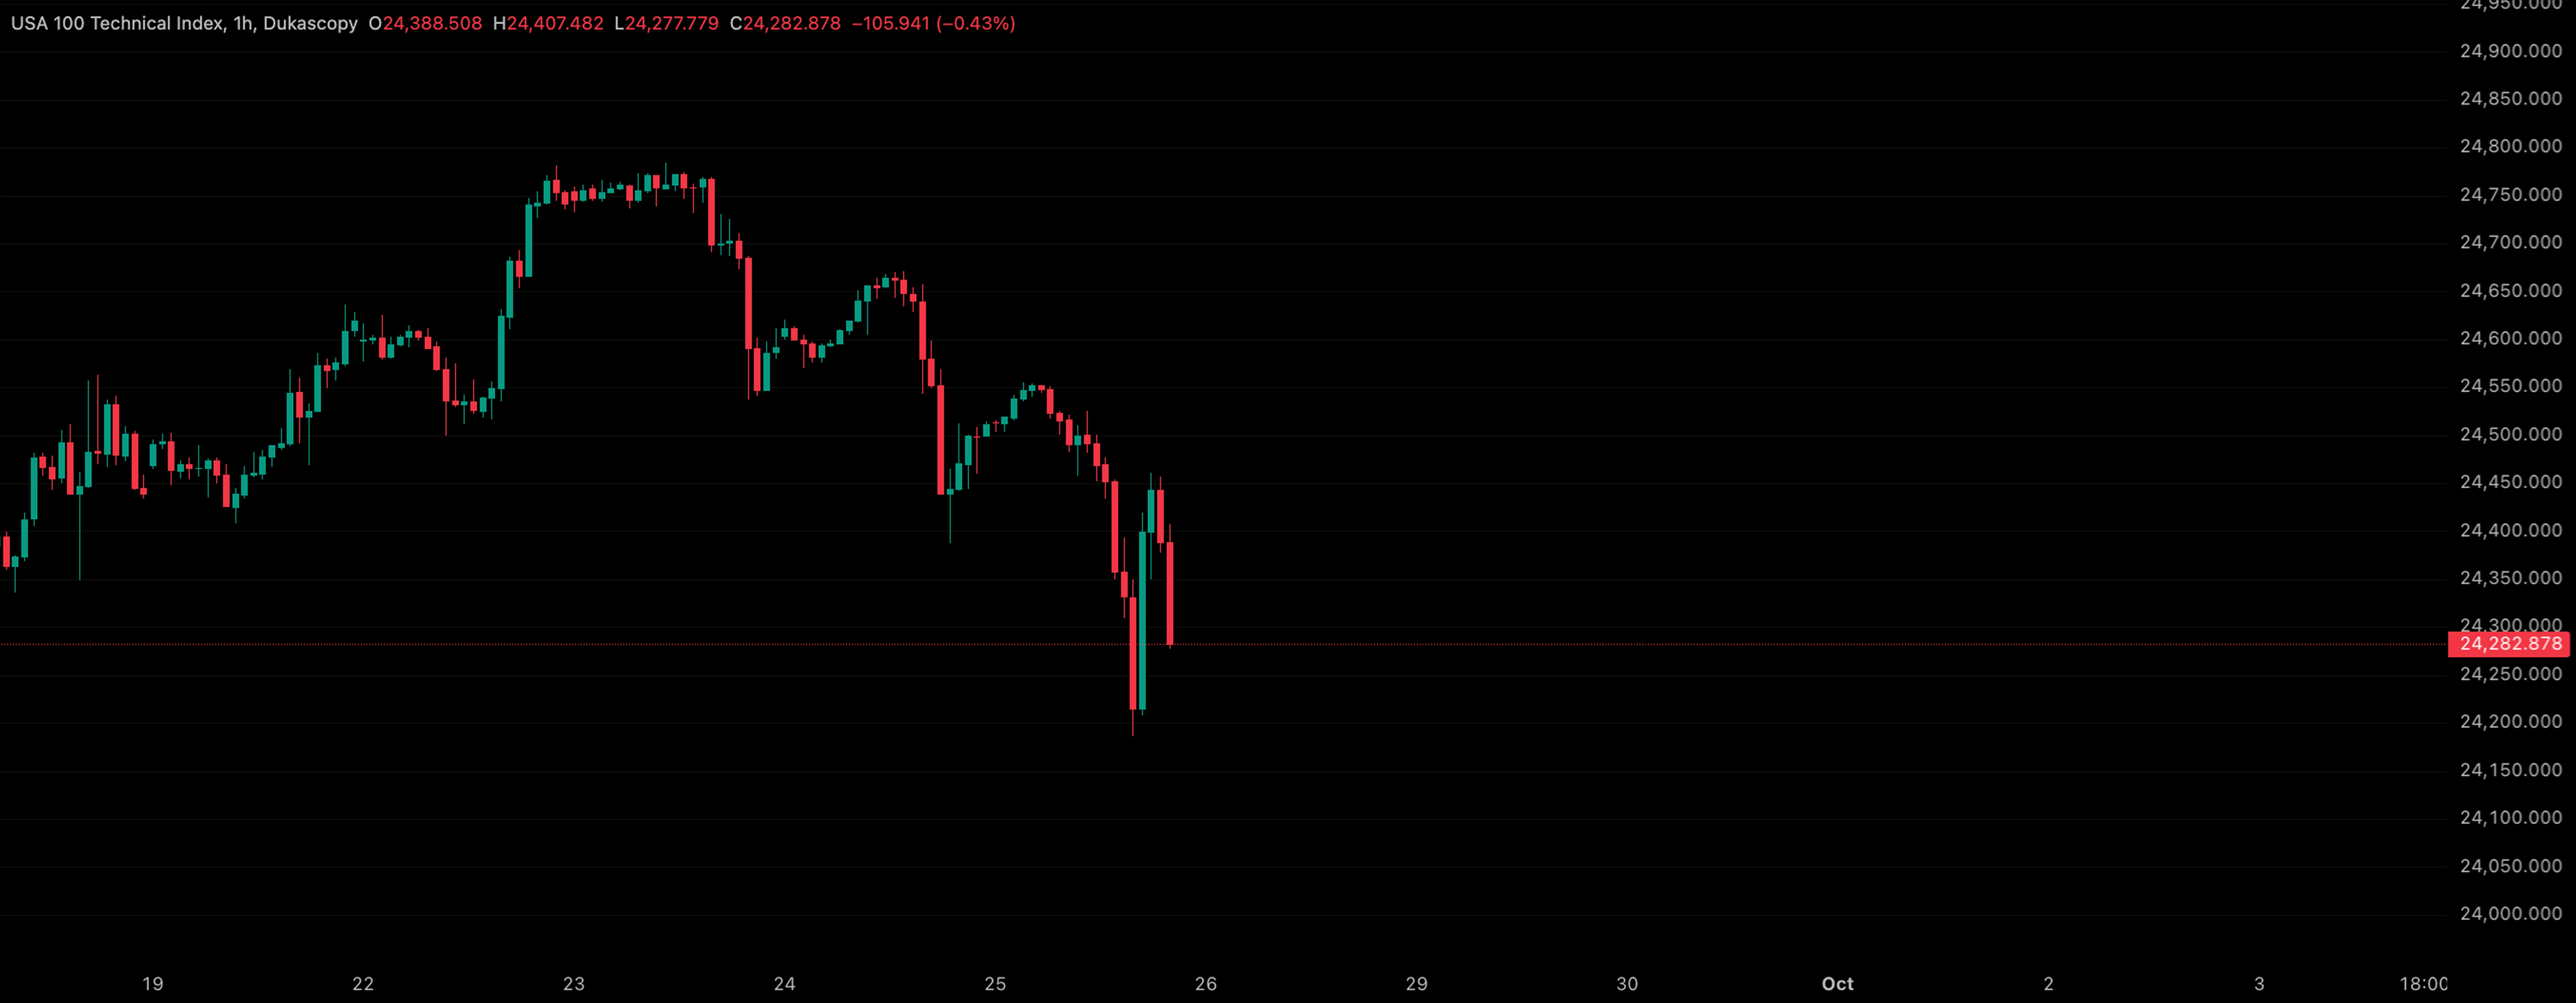
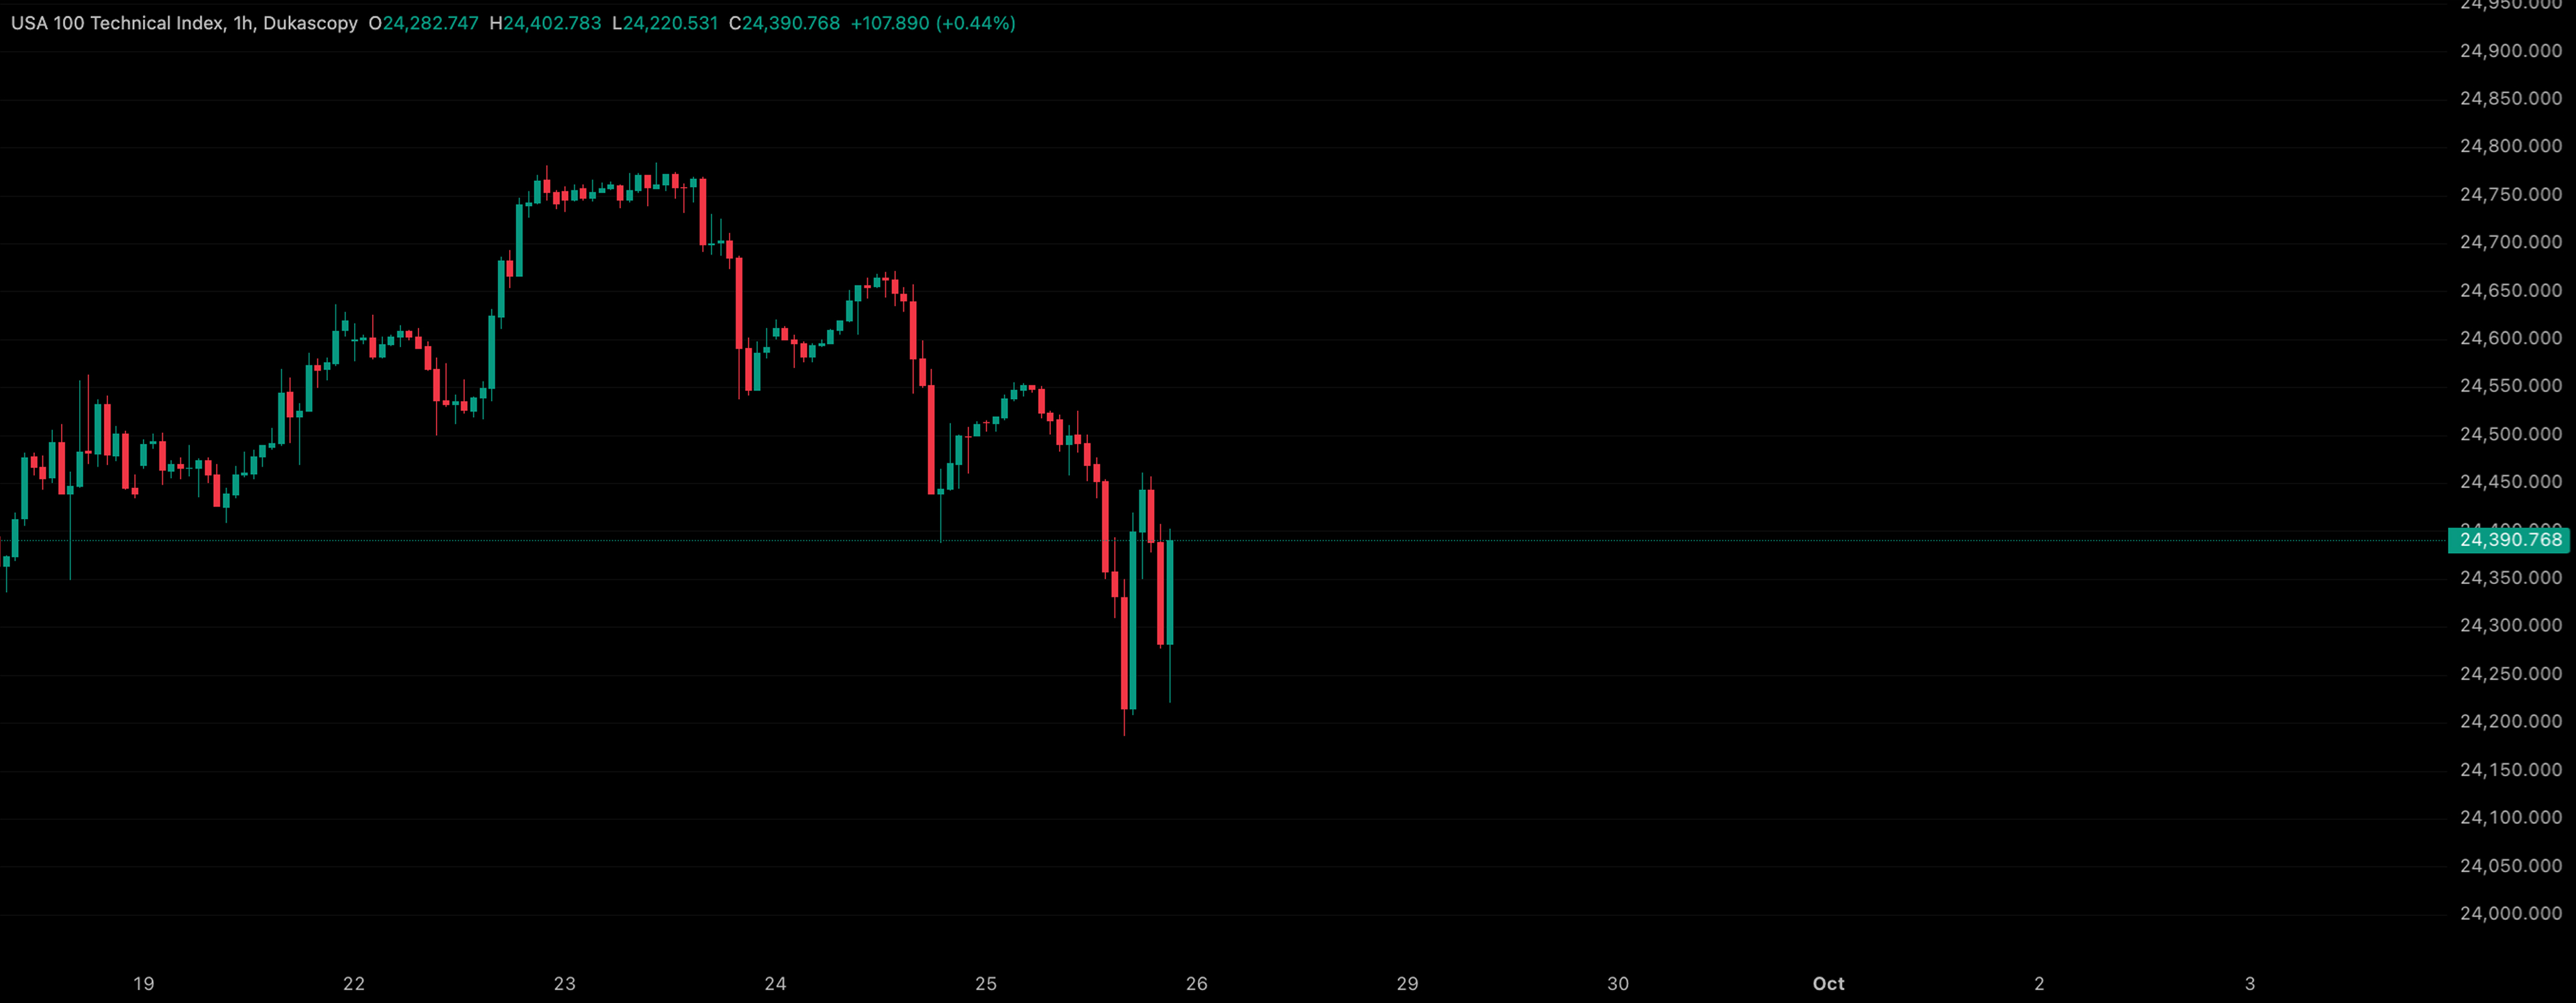
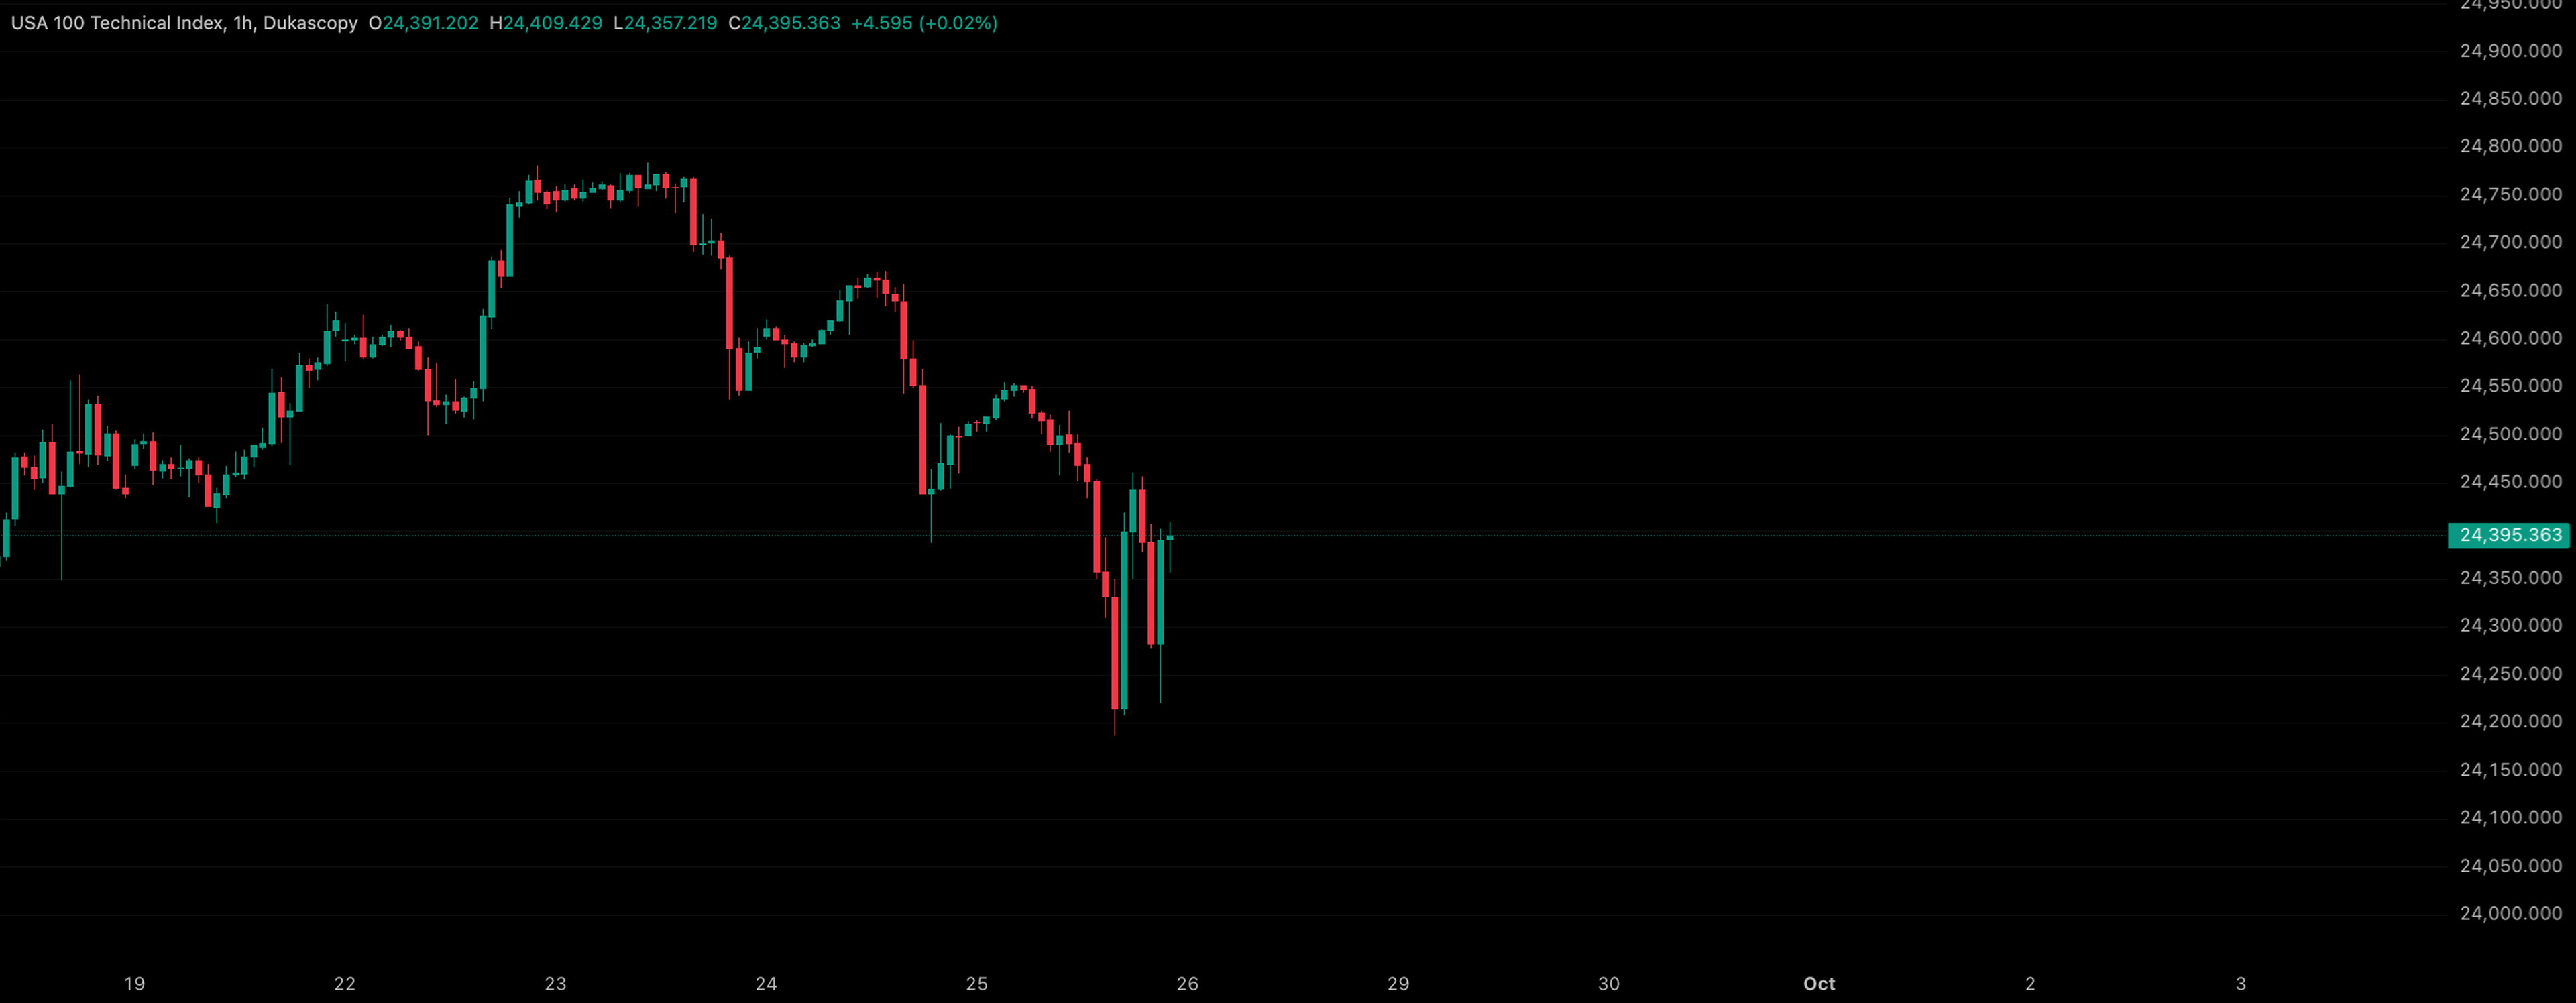
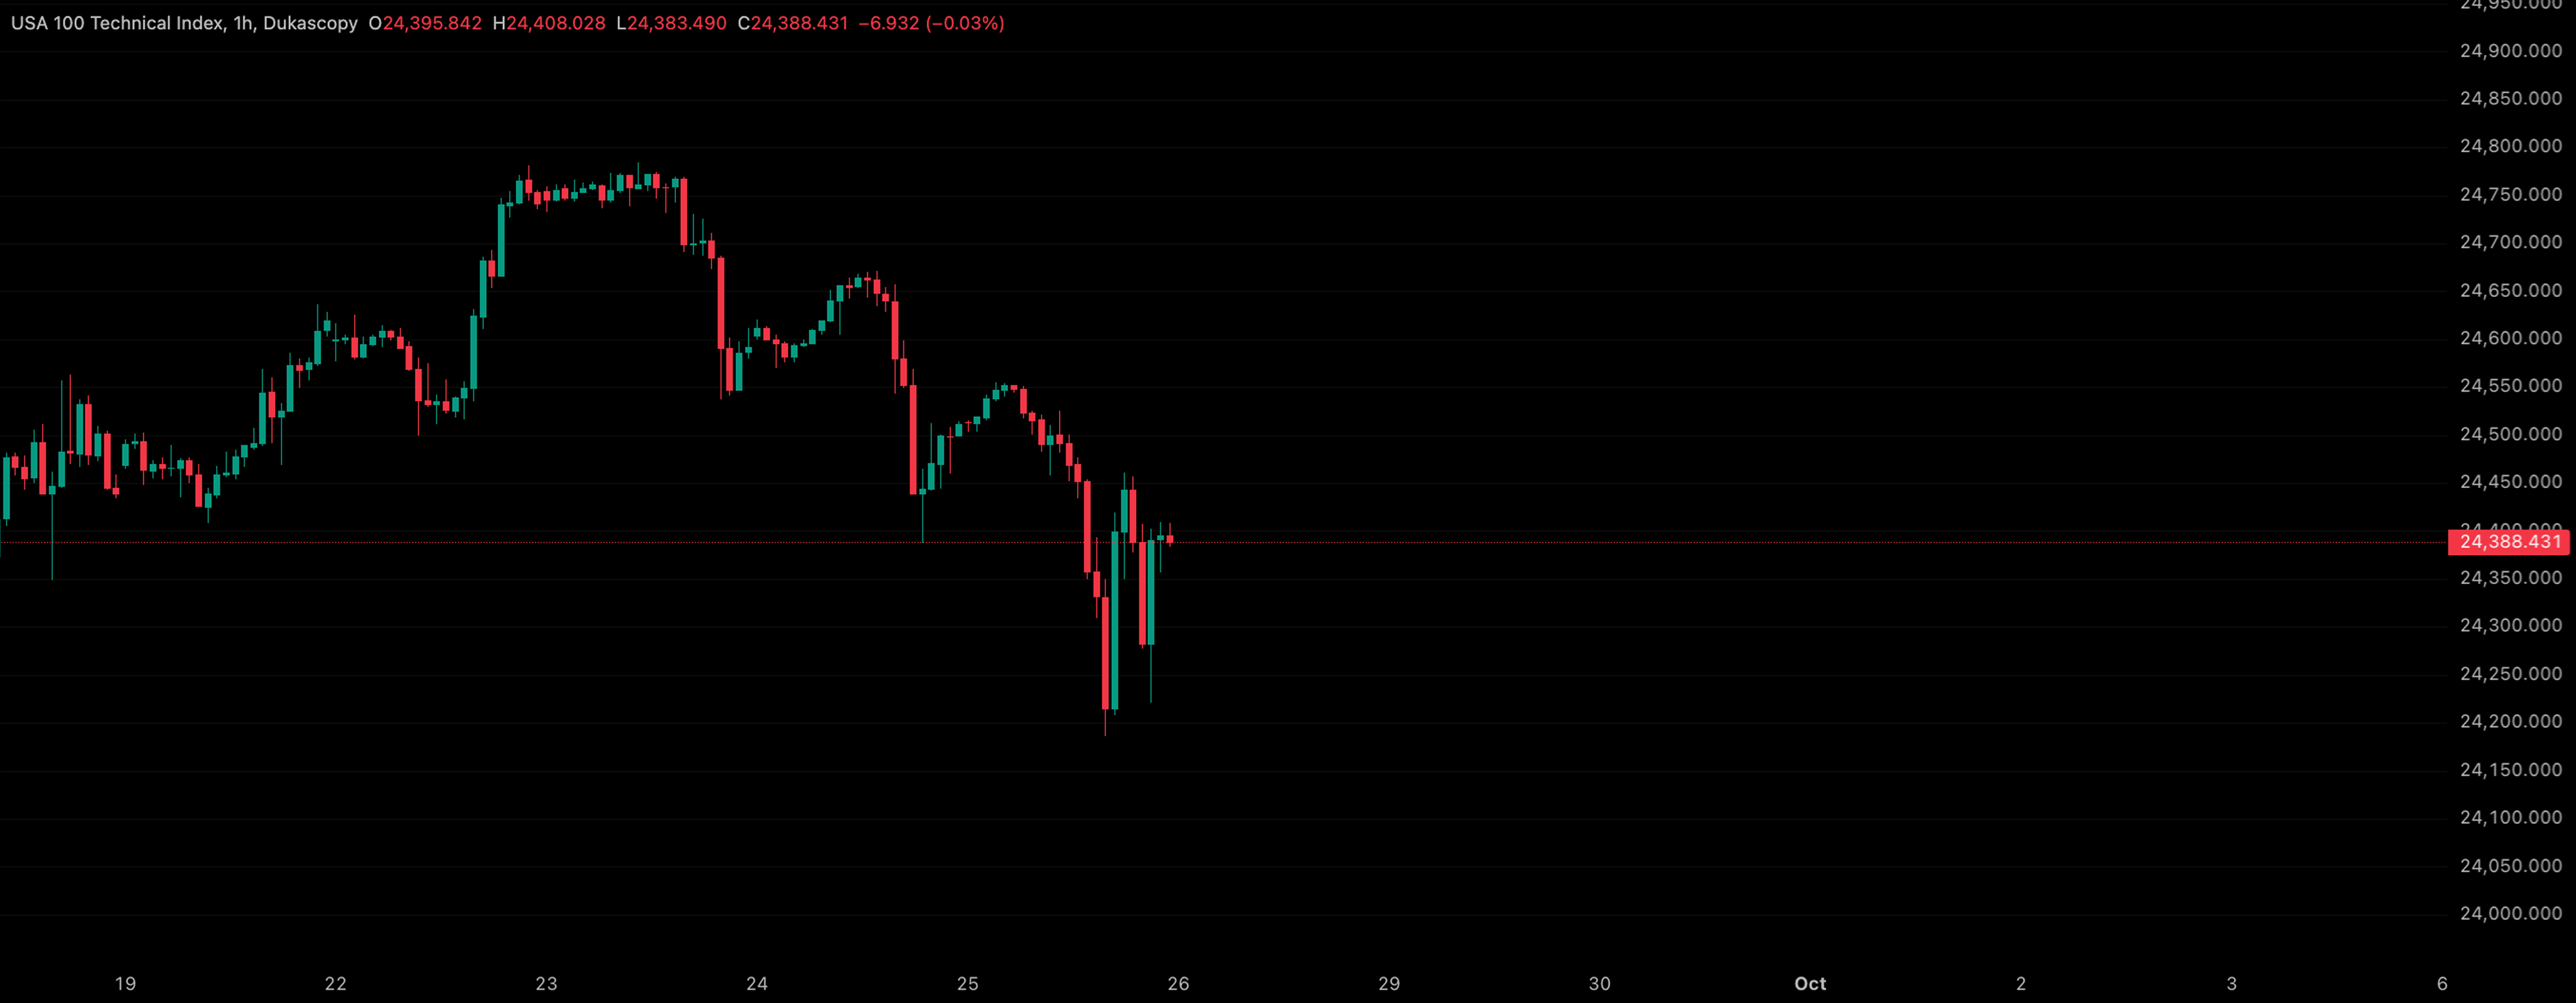
Replay historical markets, test your trading strategies, and see how they perform across different market conditions.
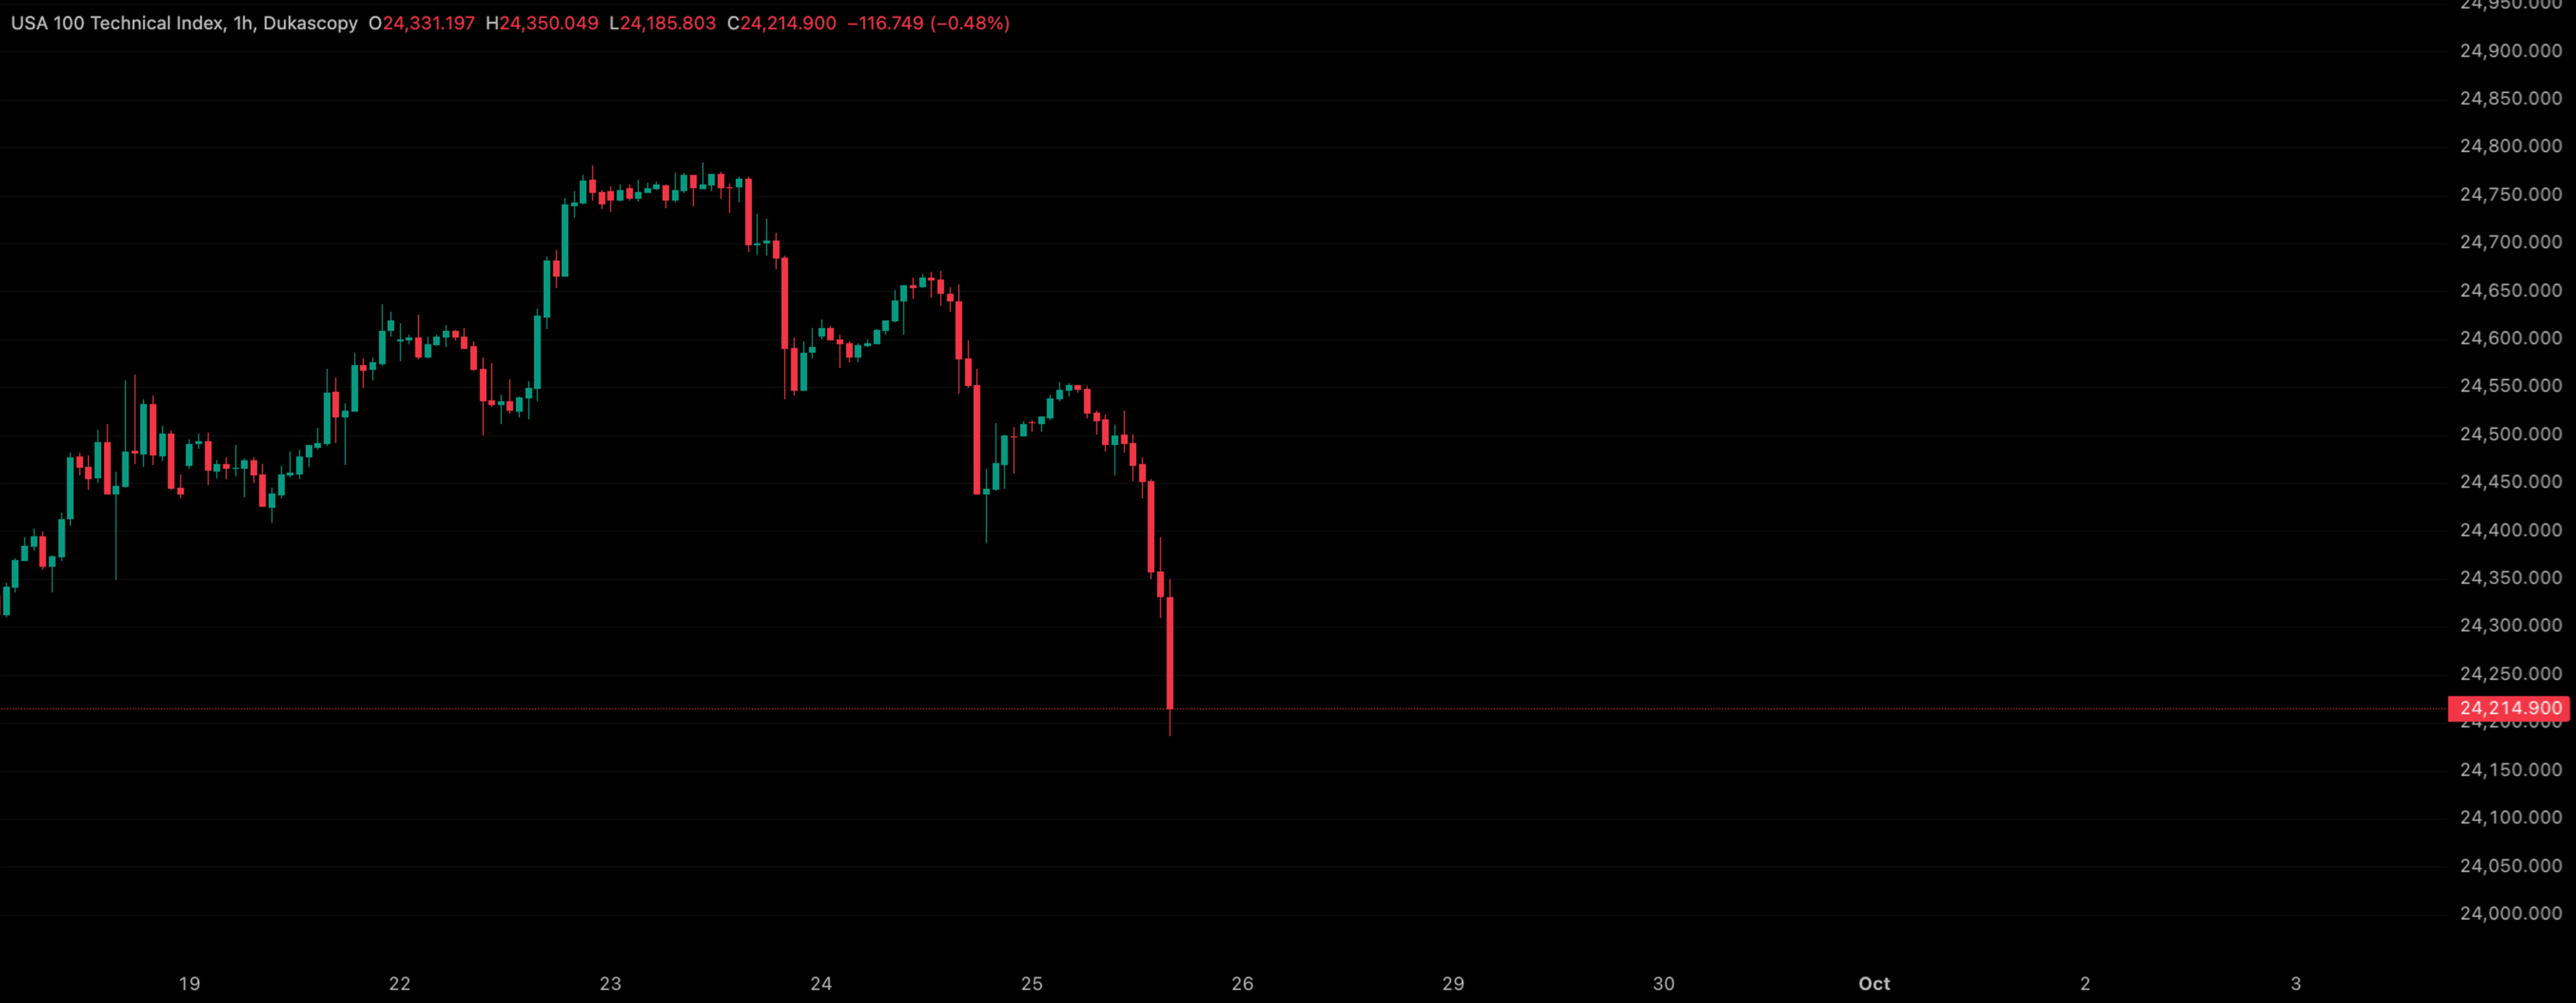
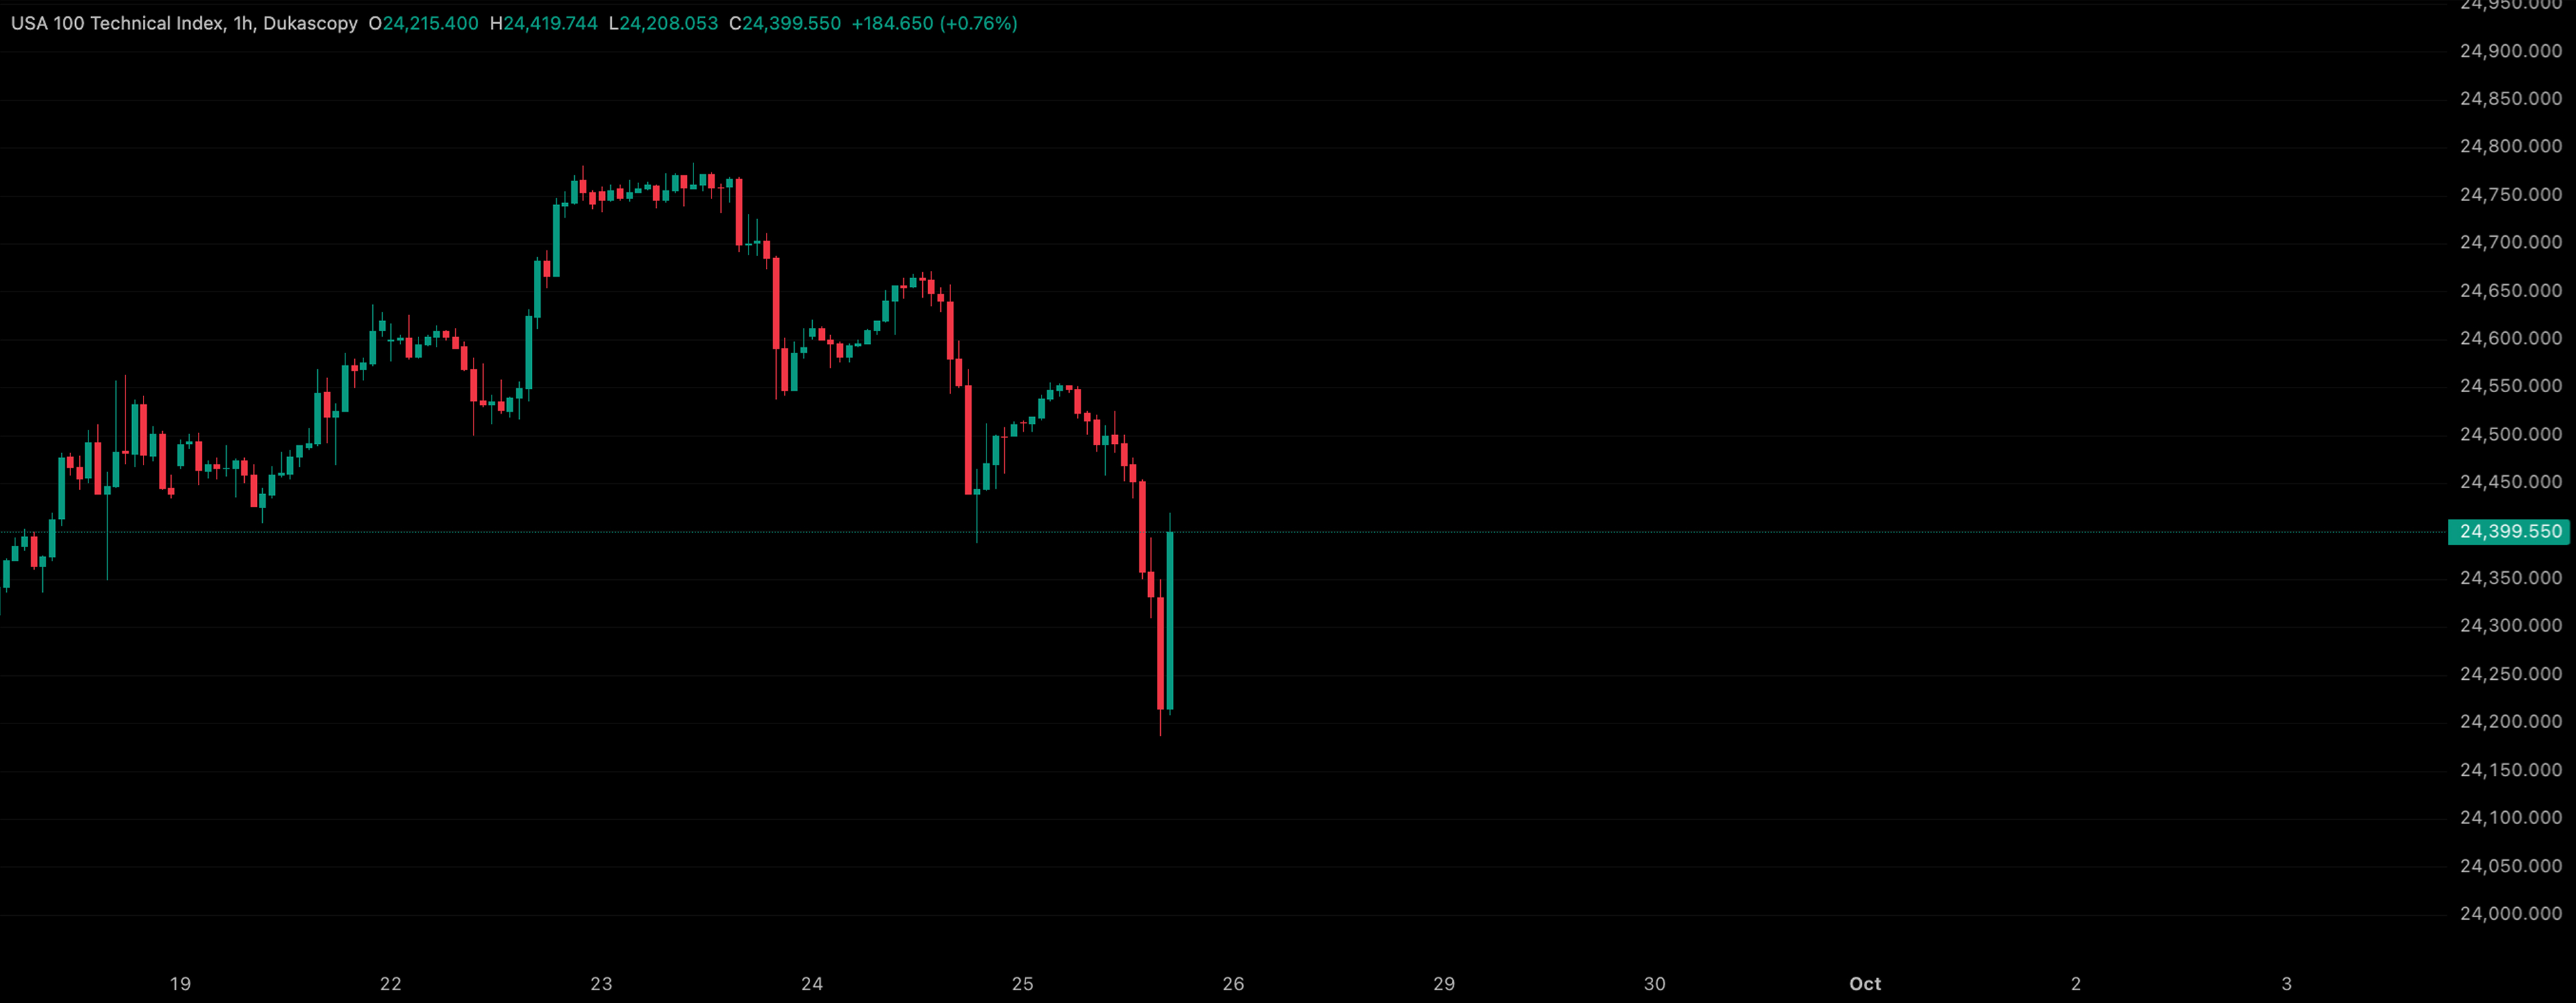
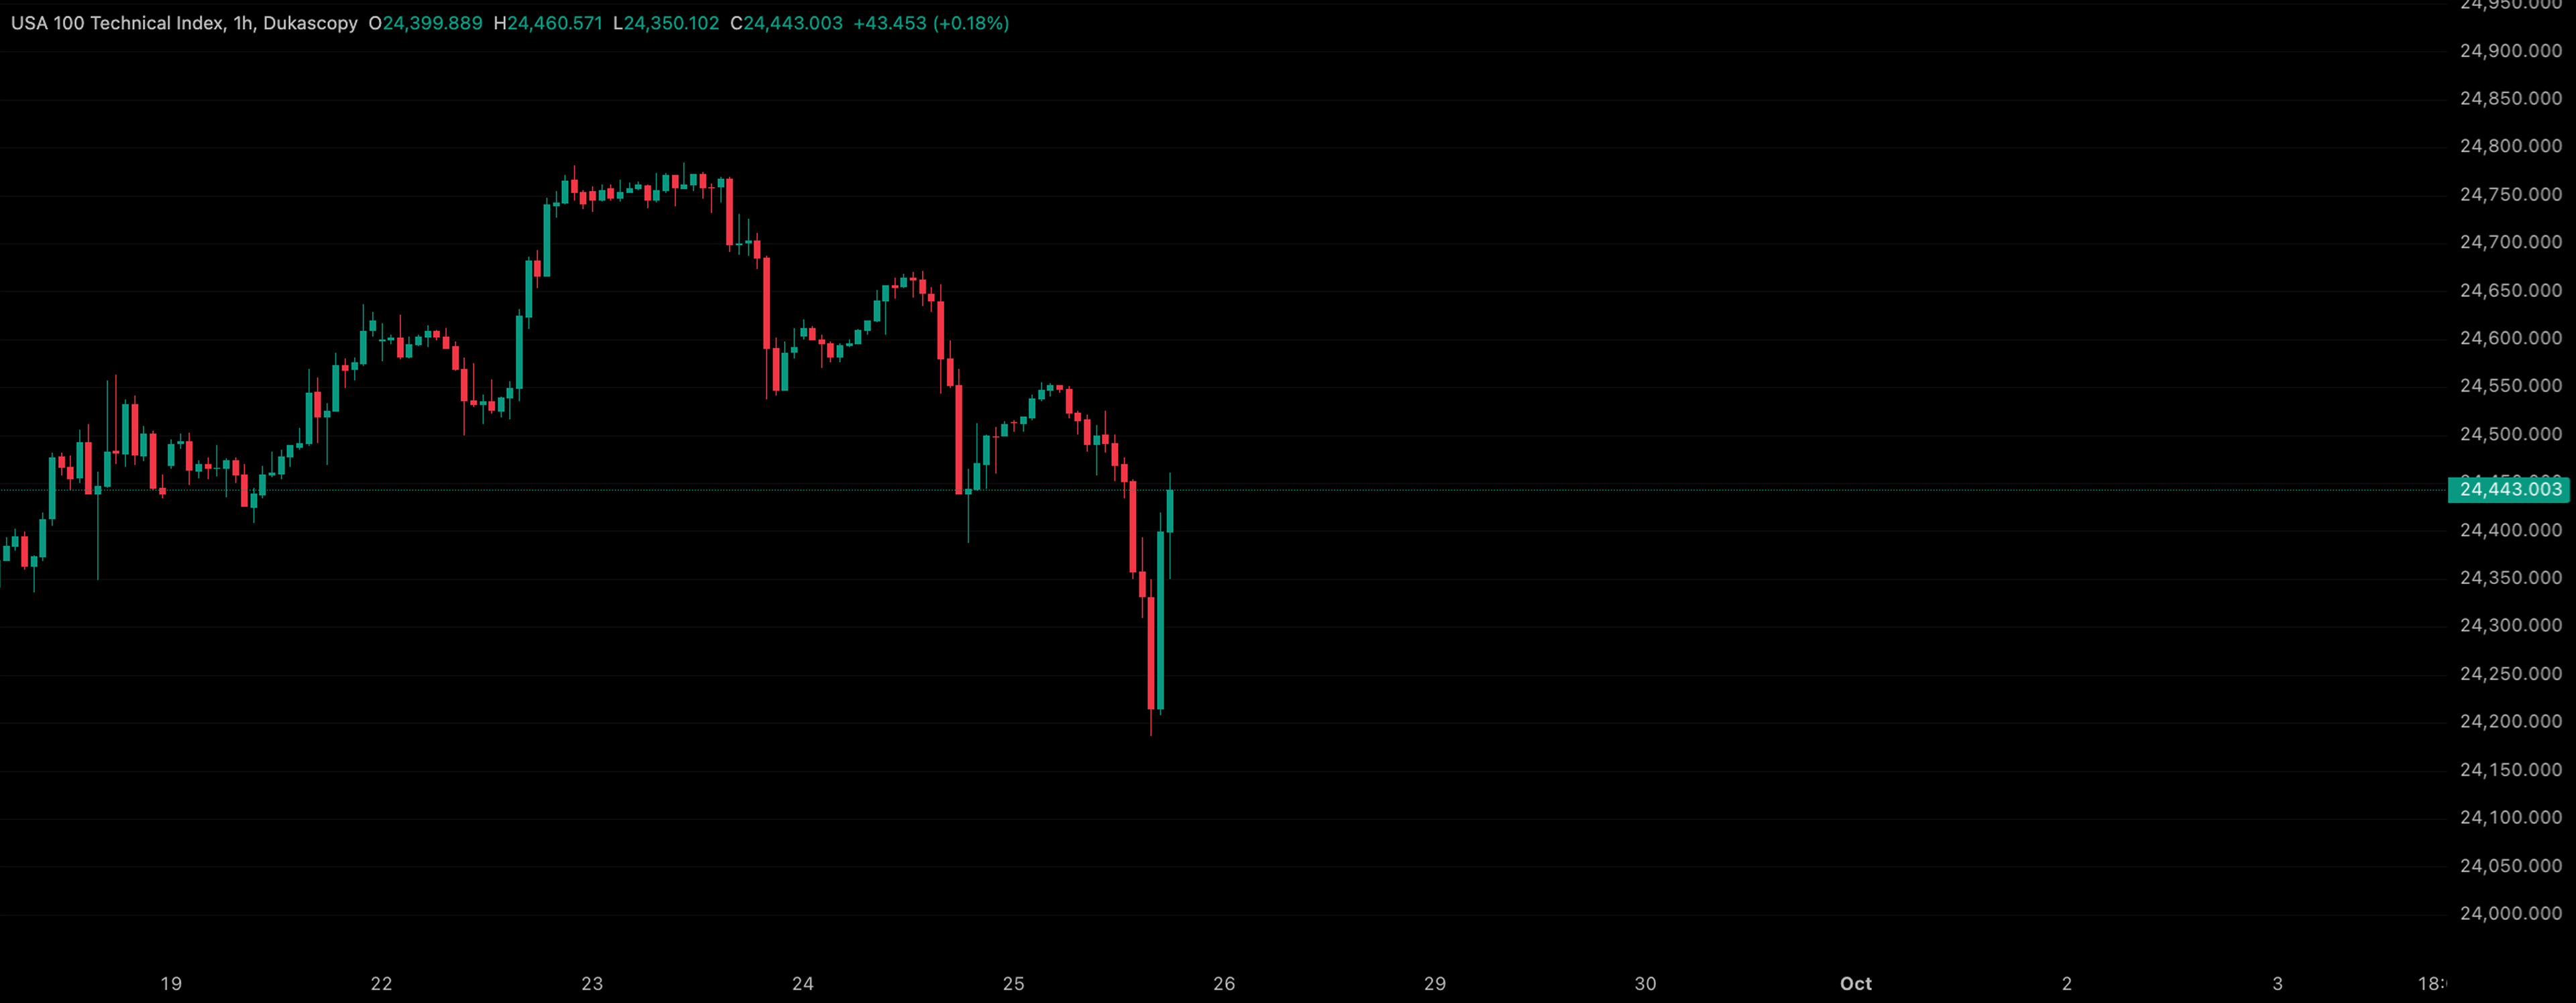
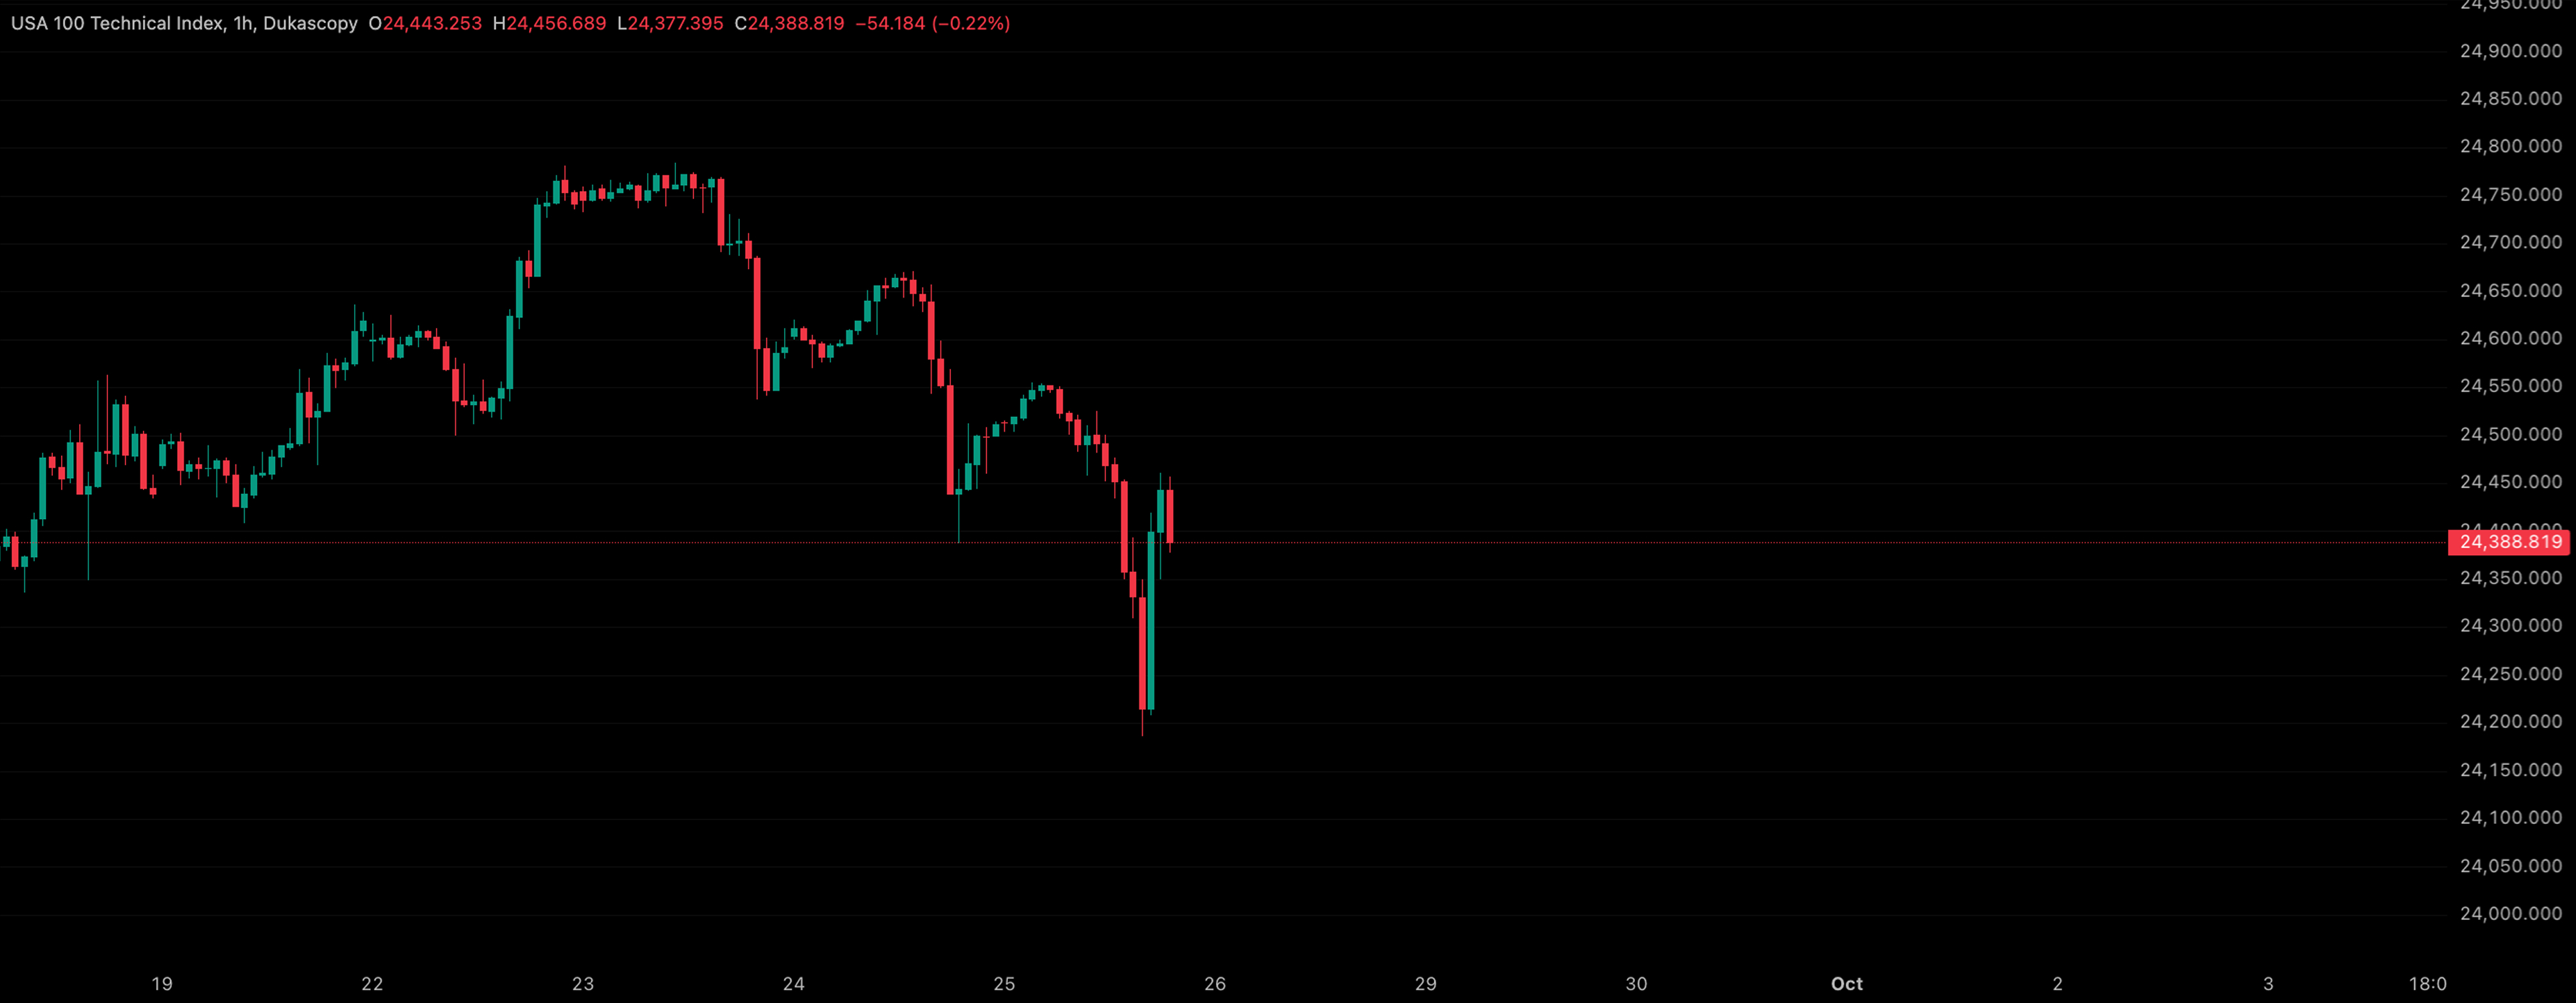
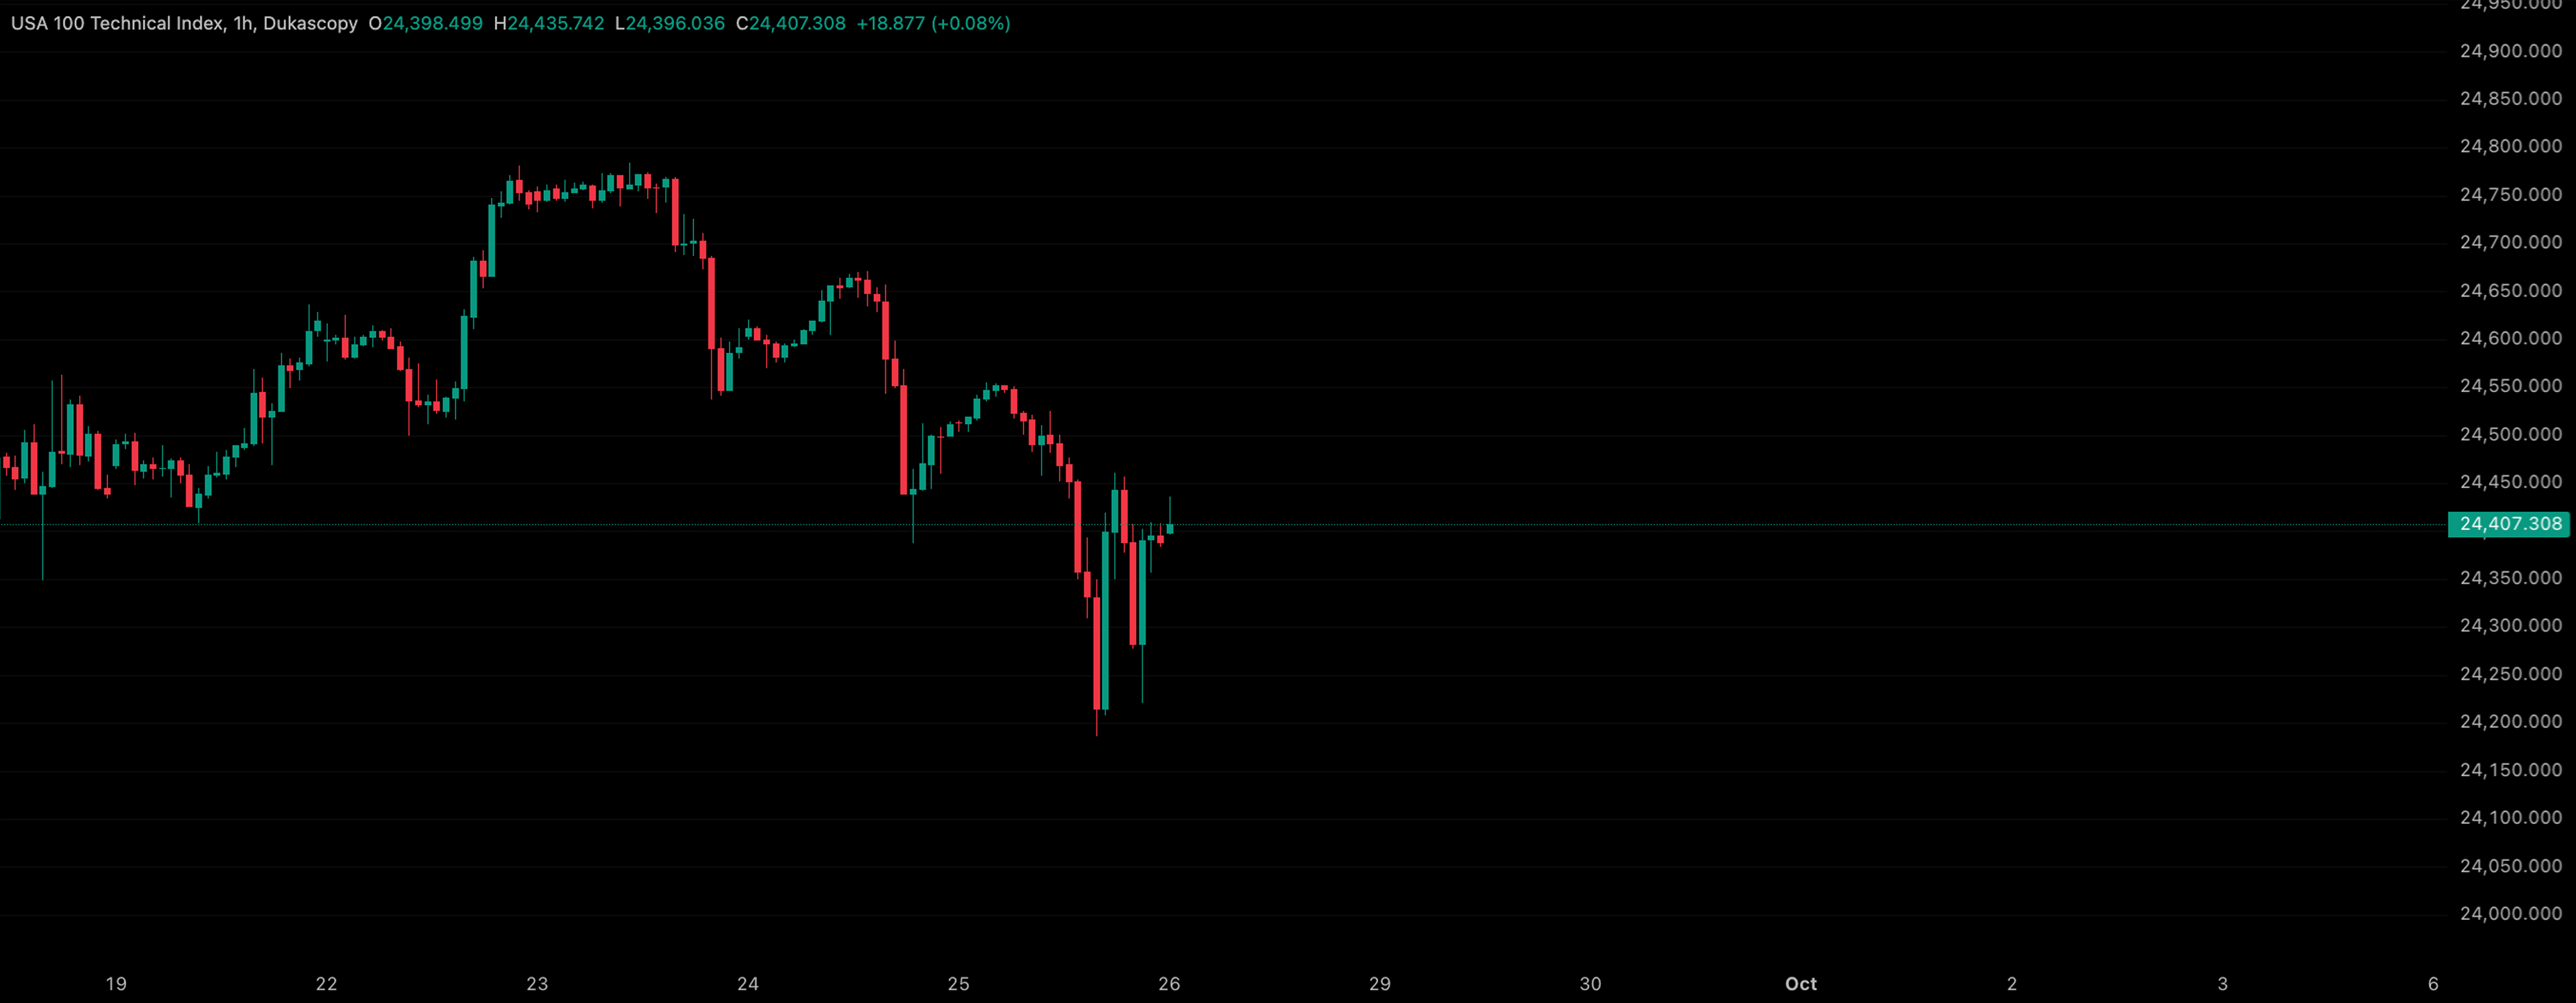
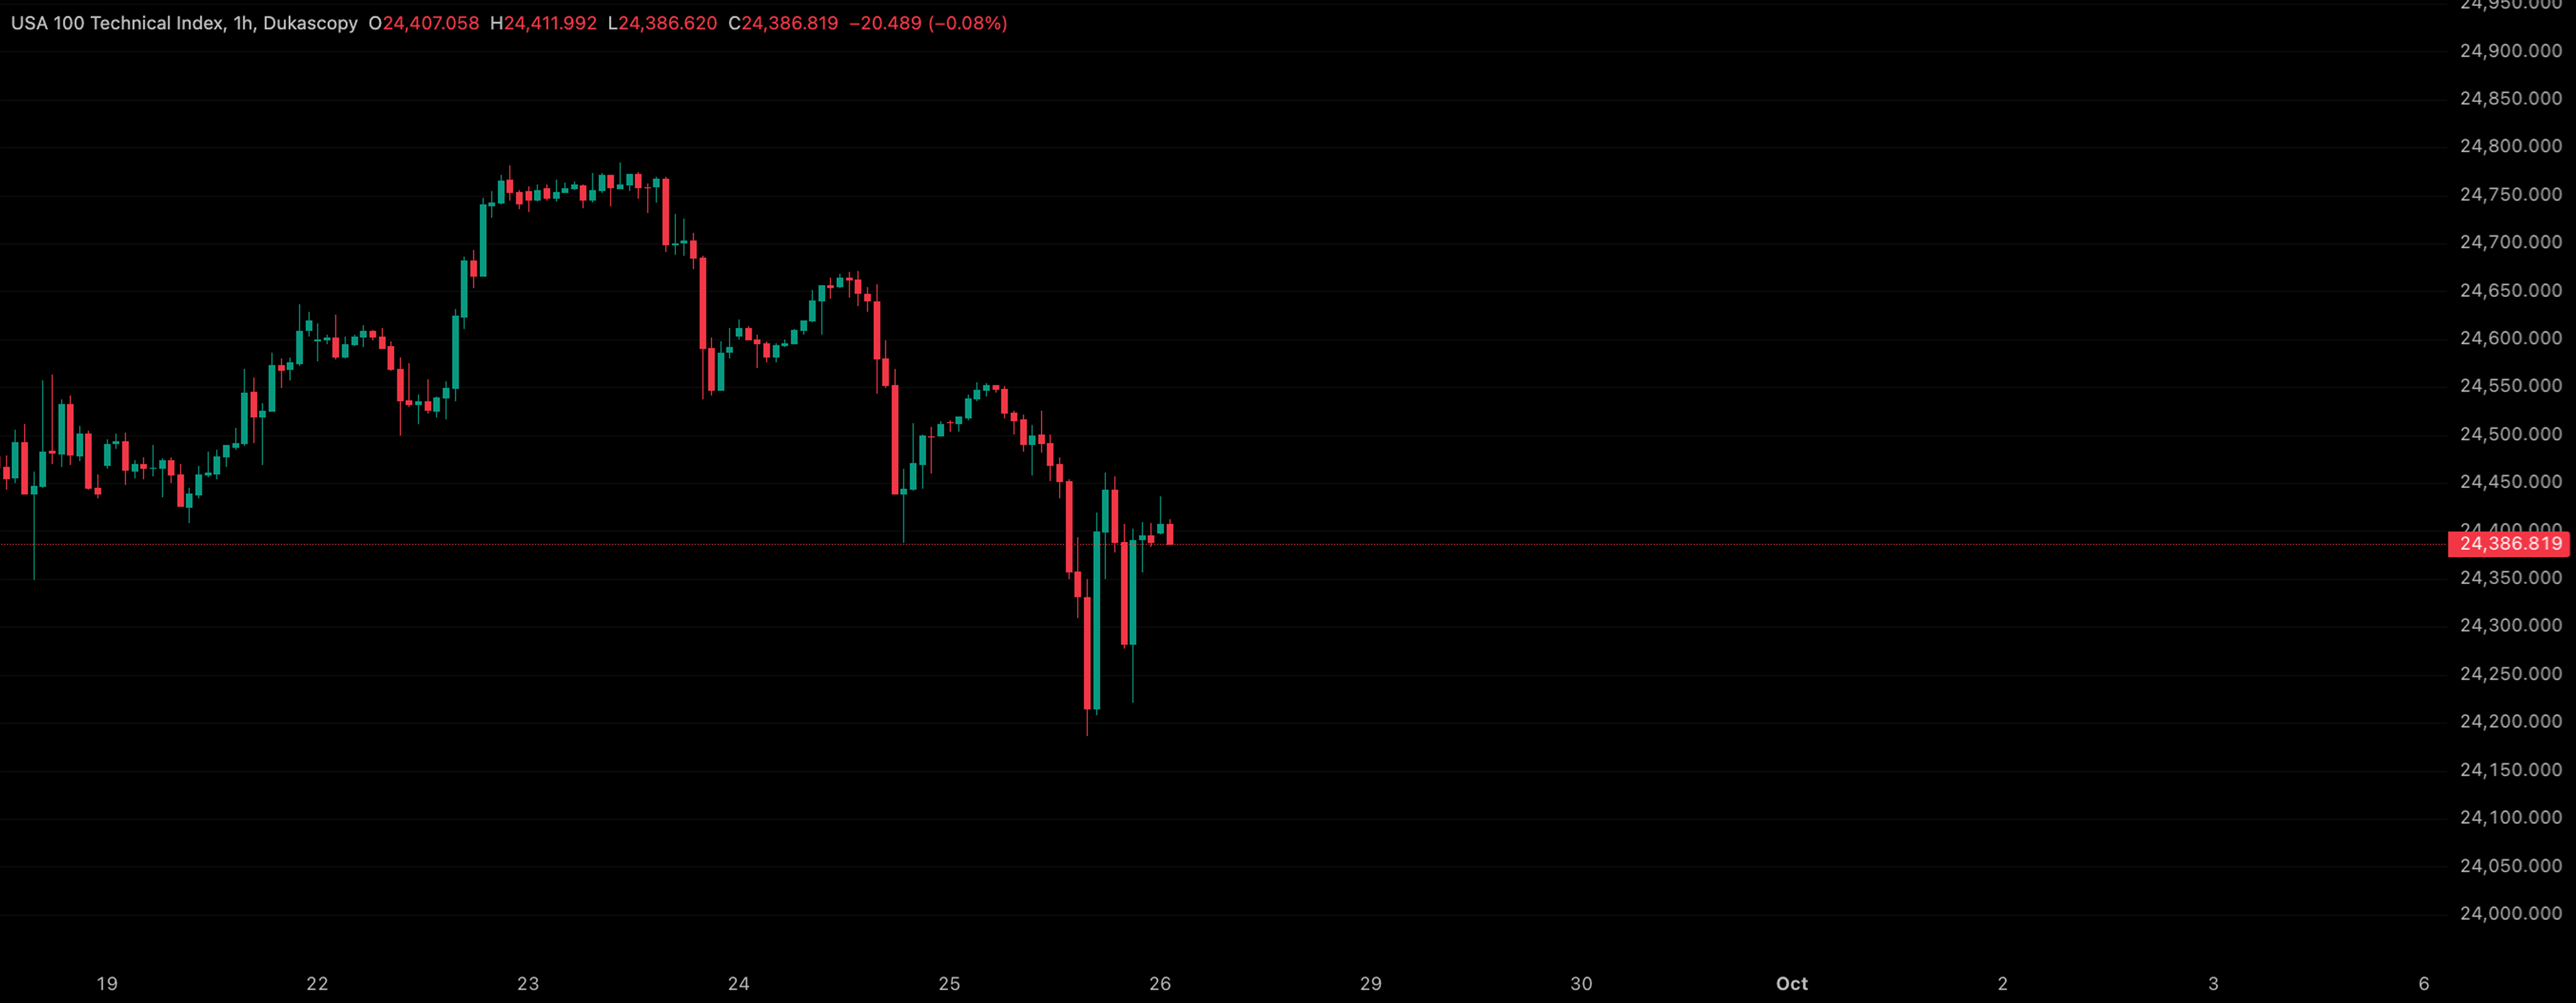
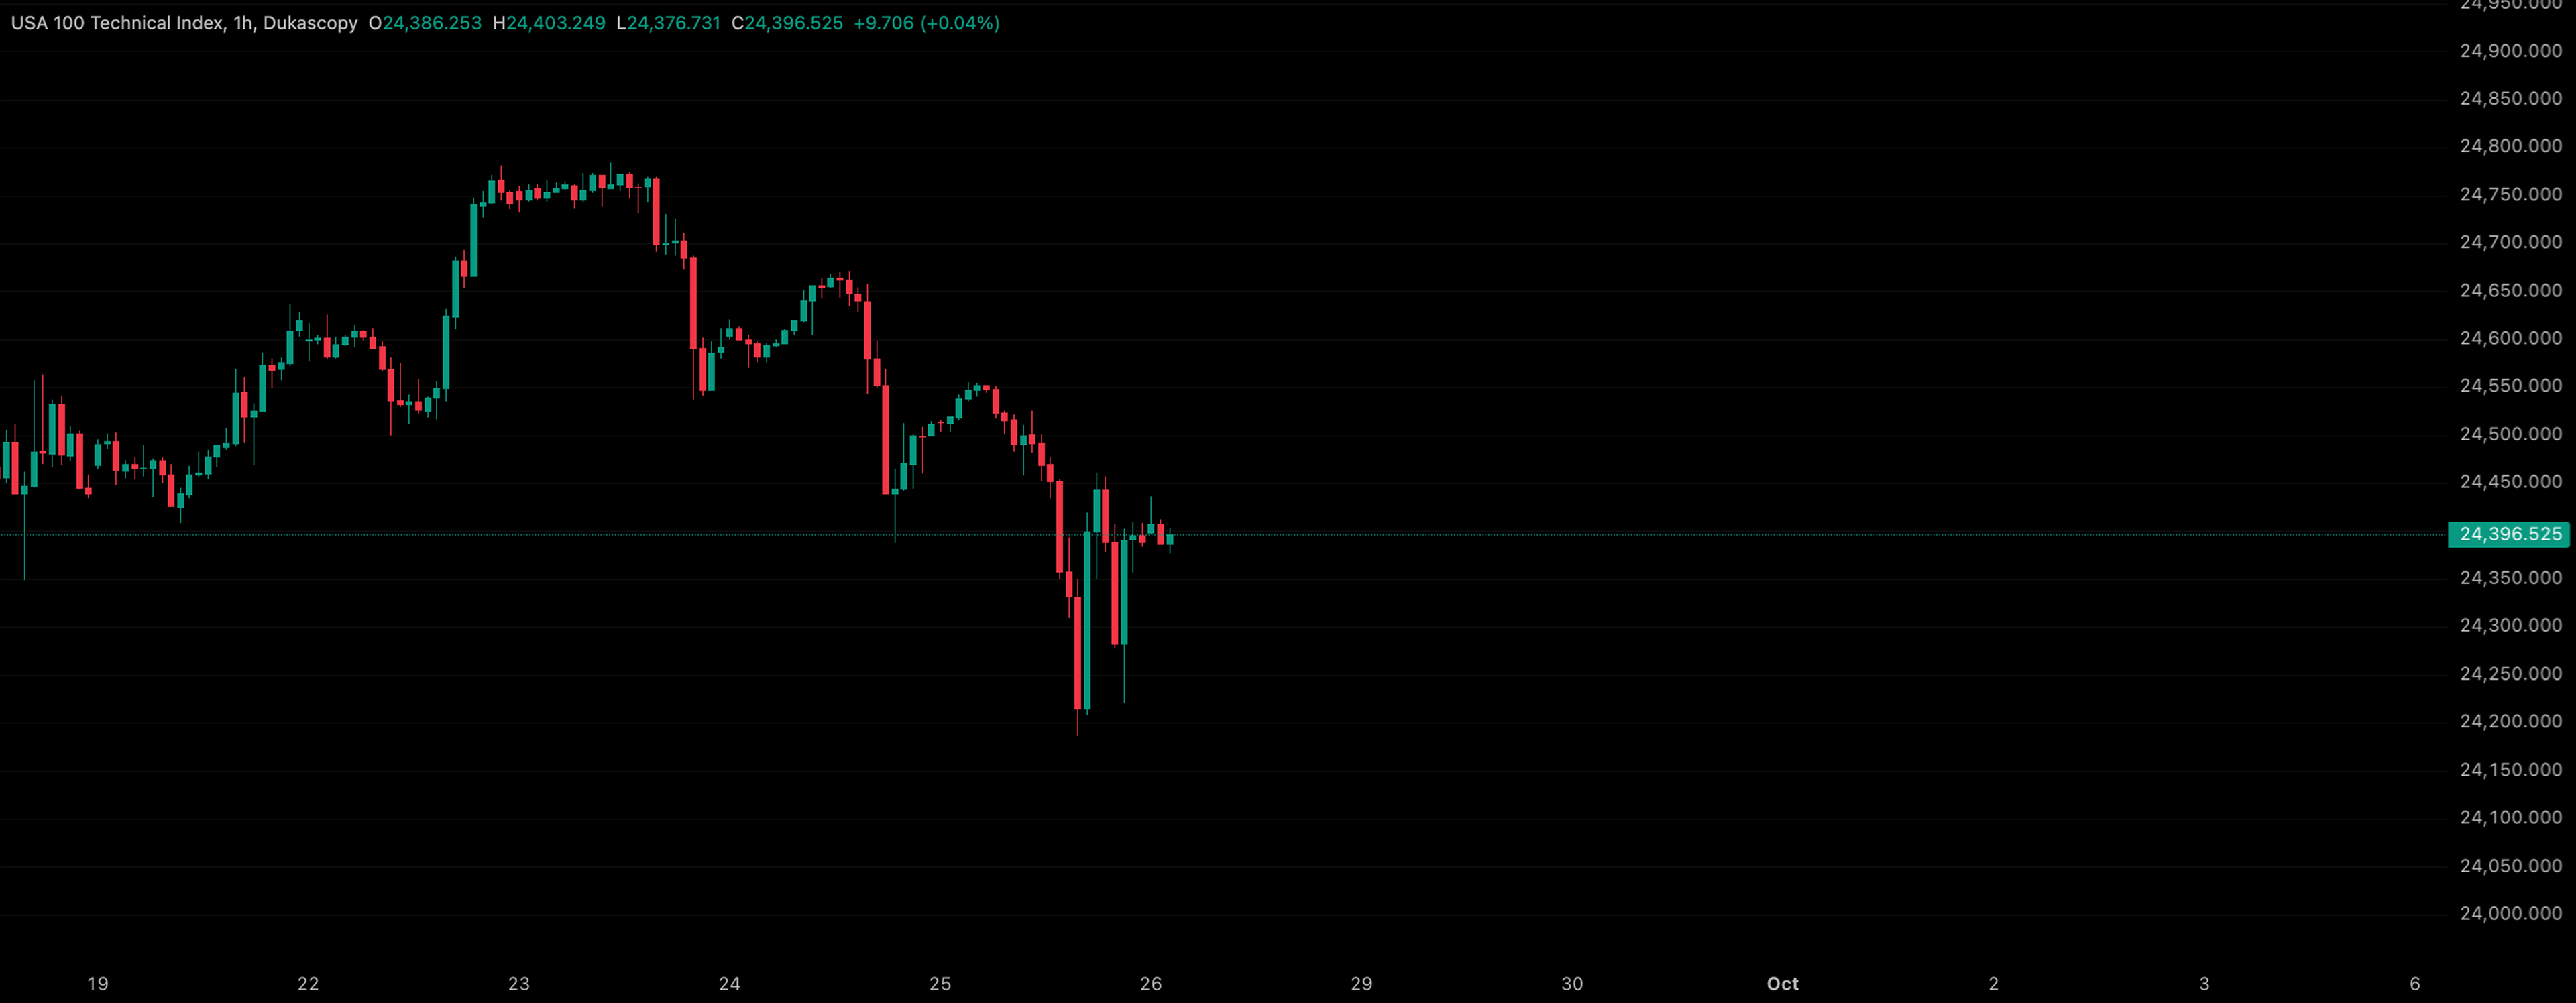
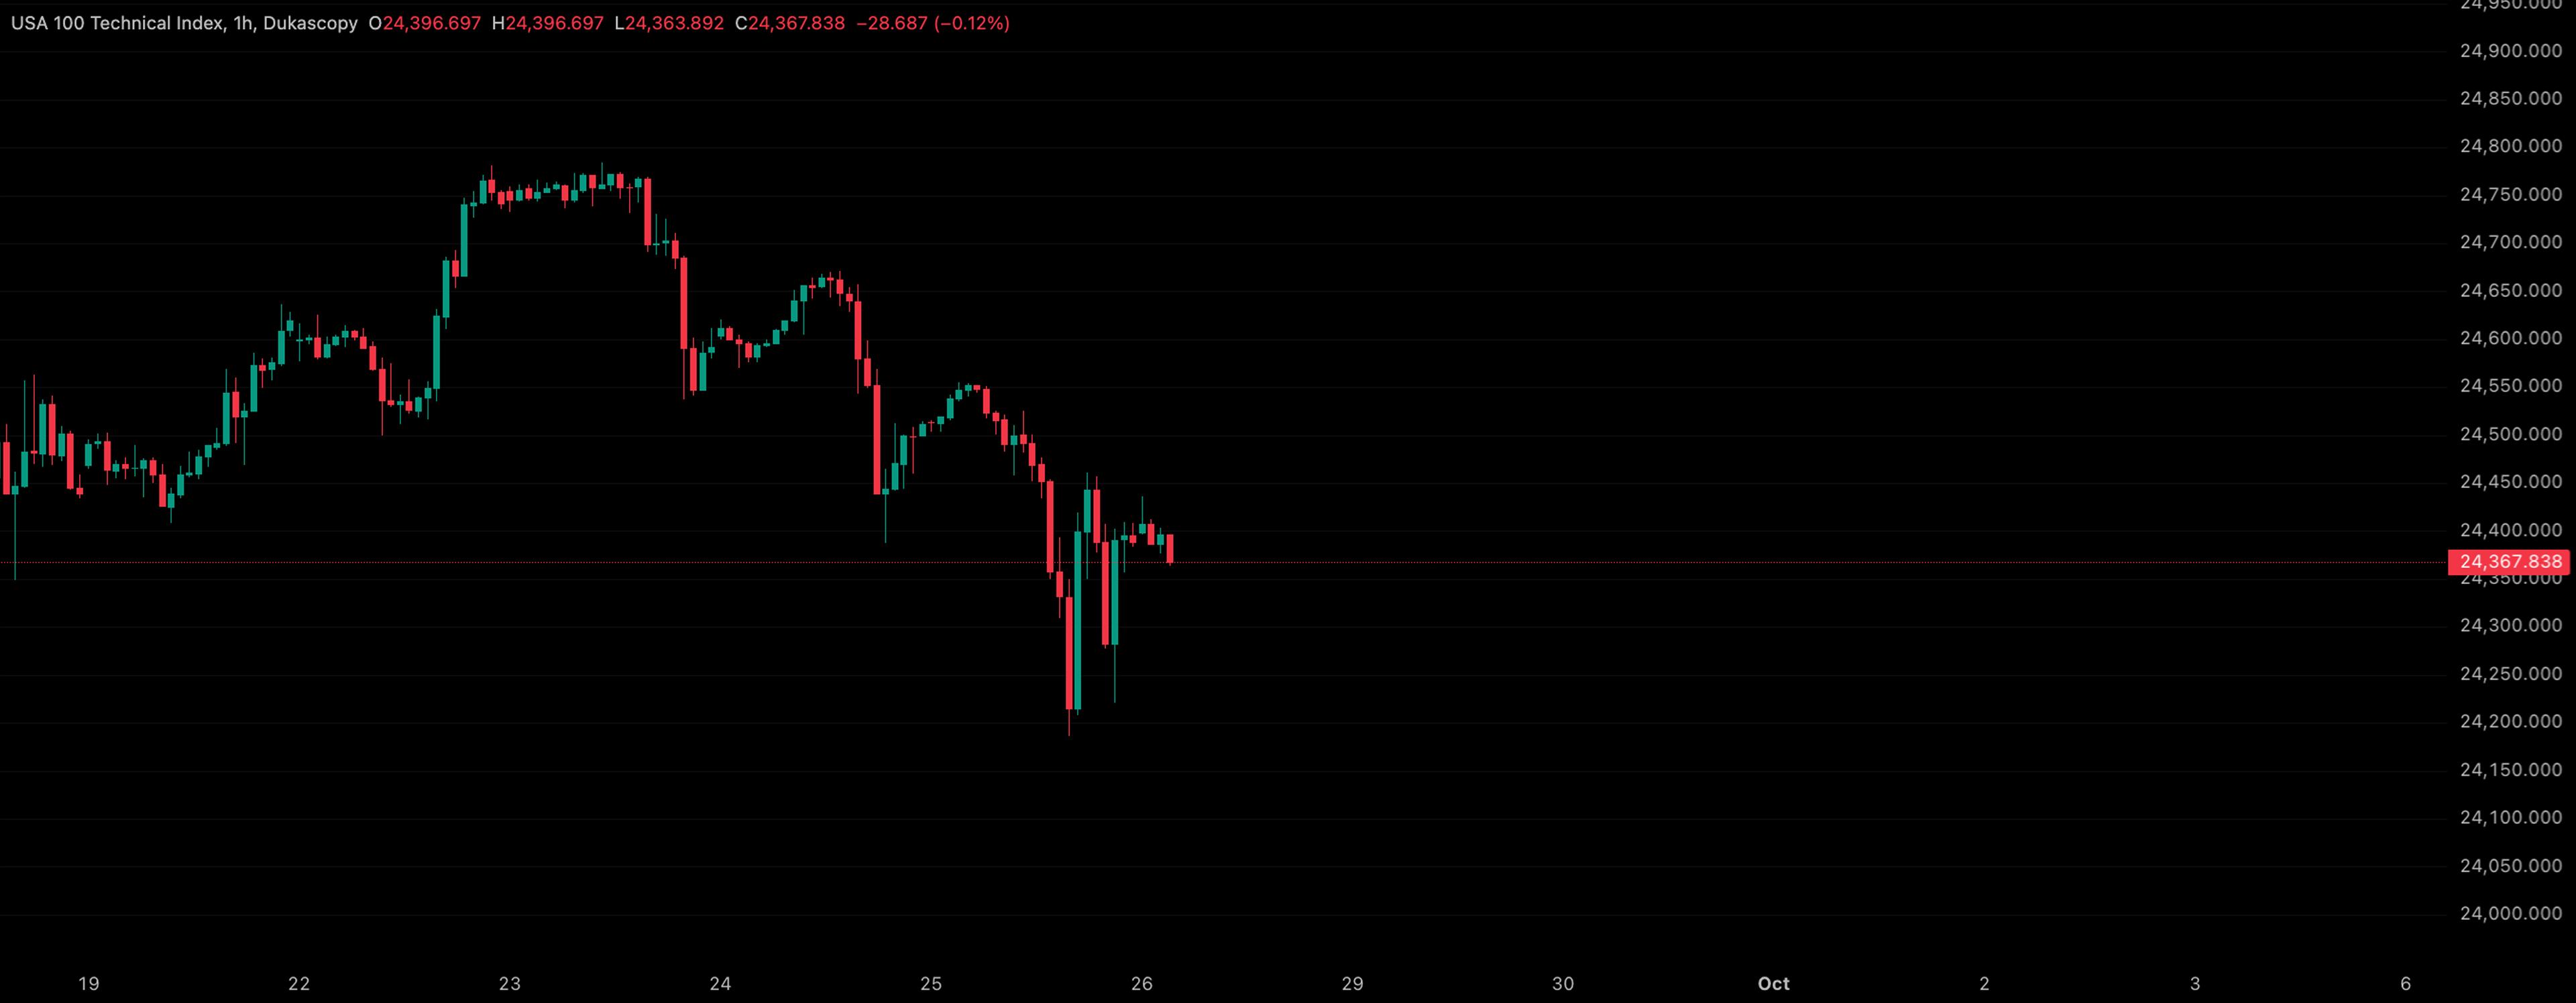
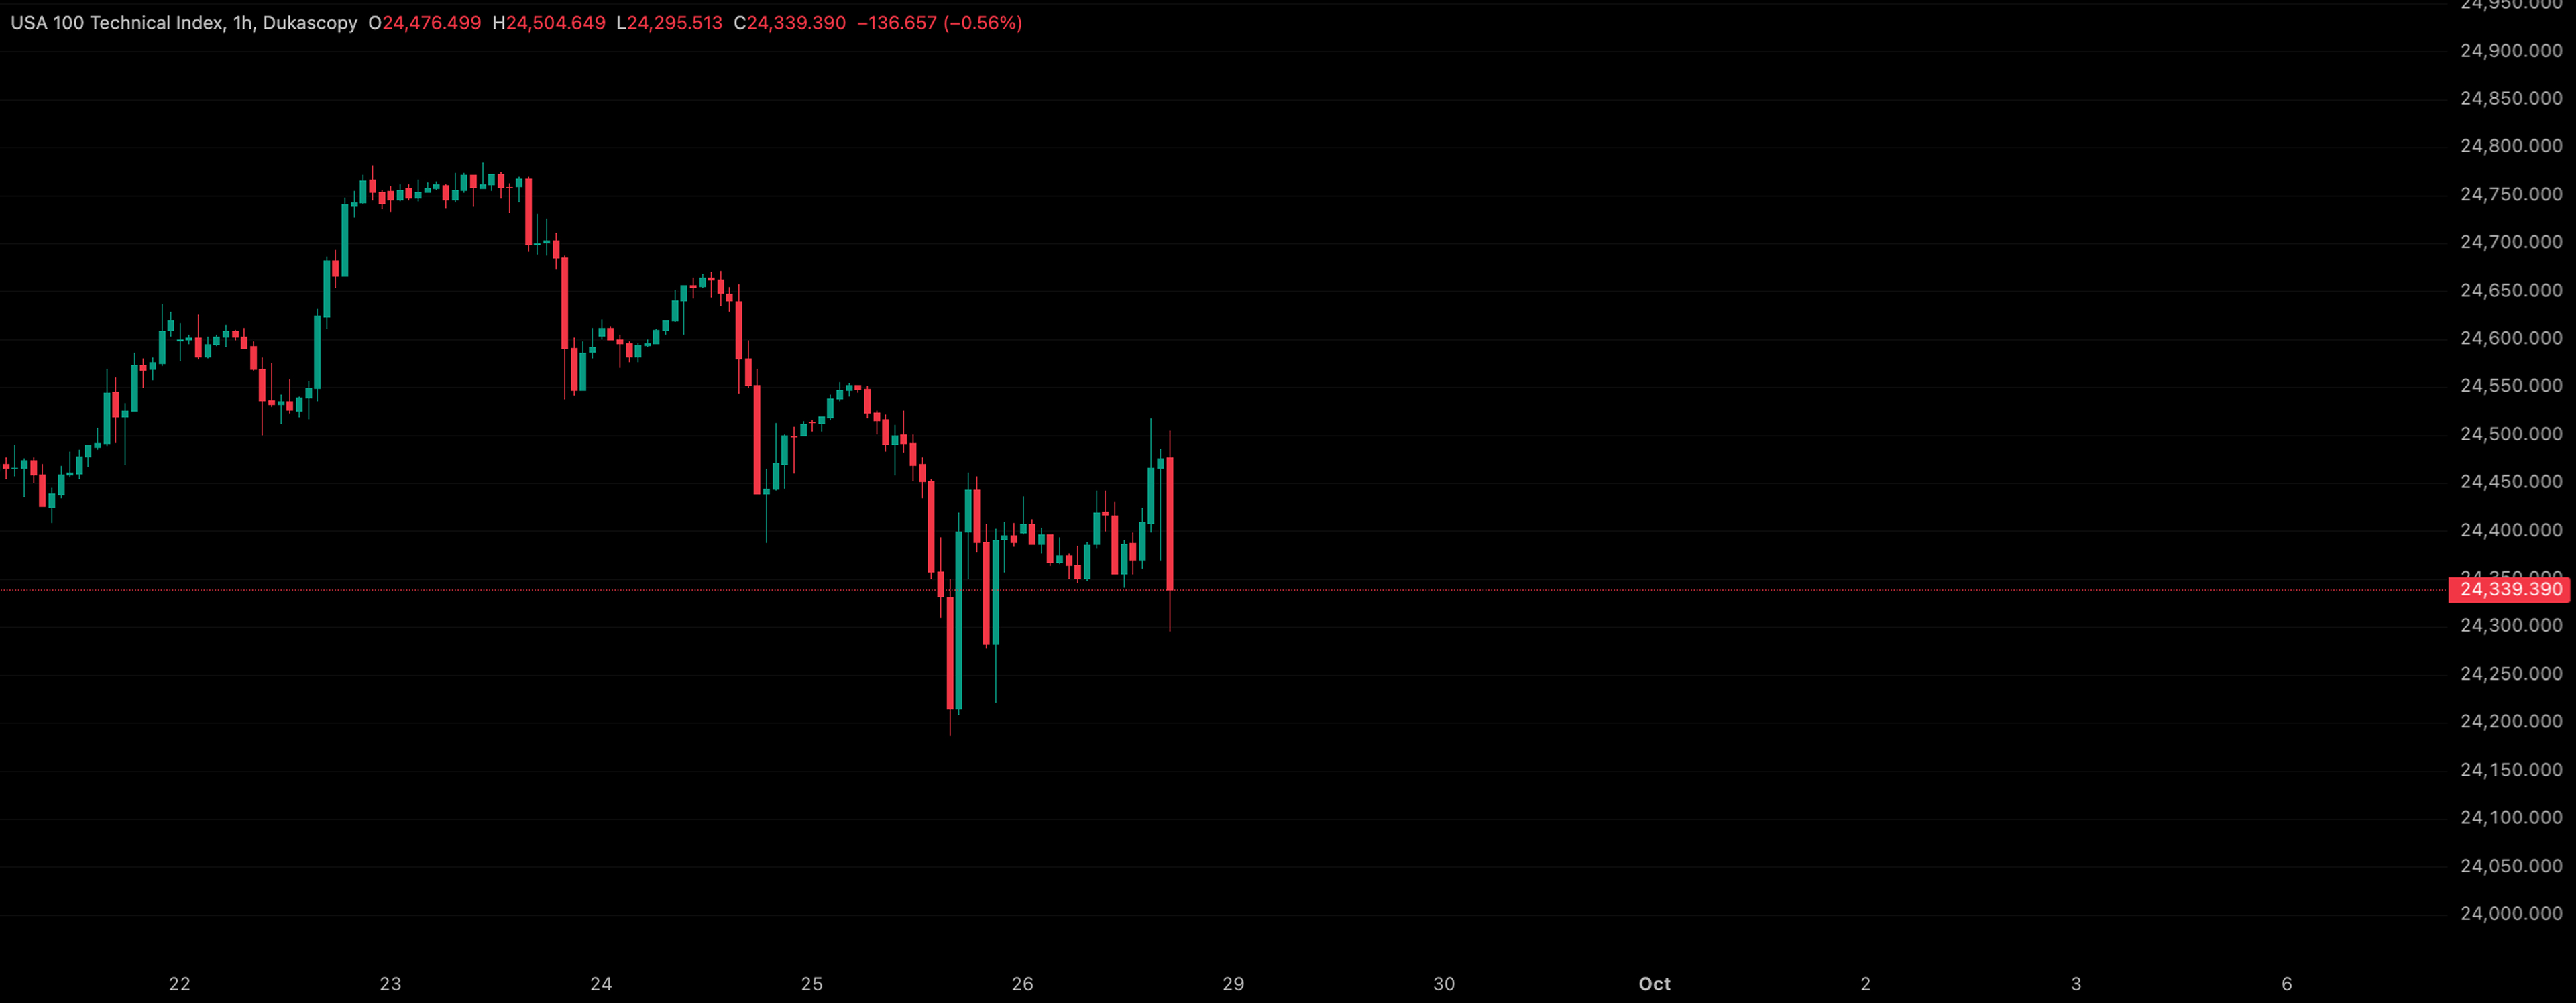
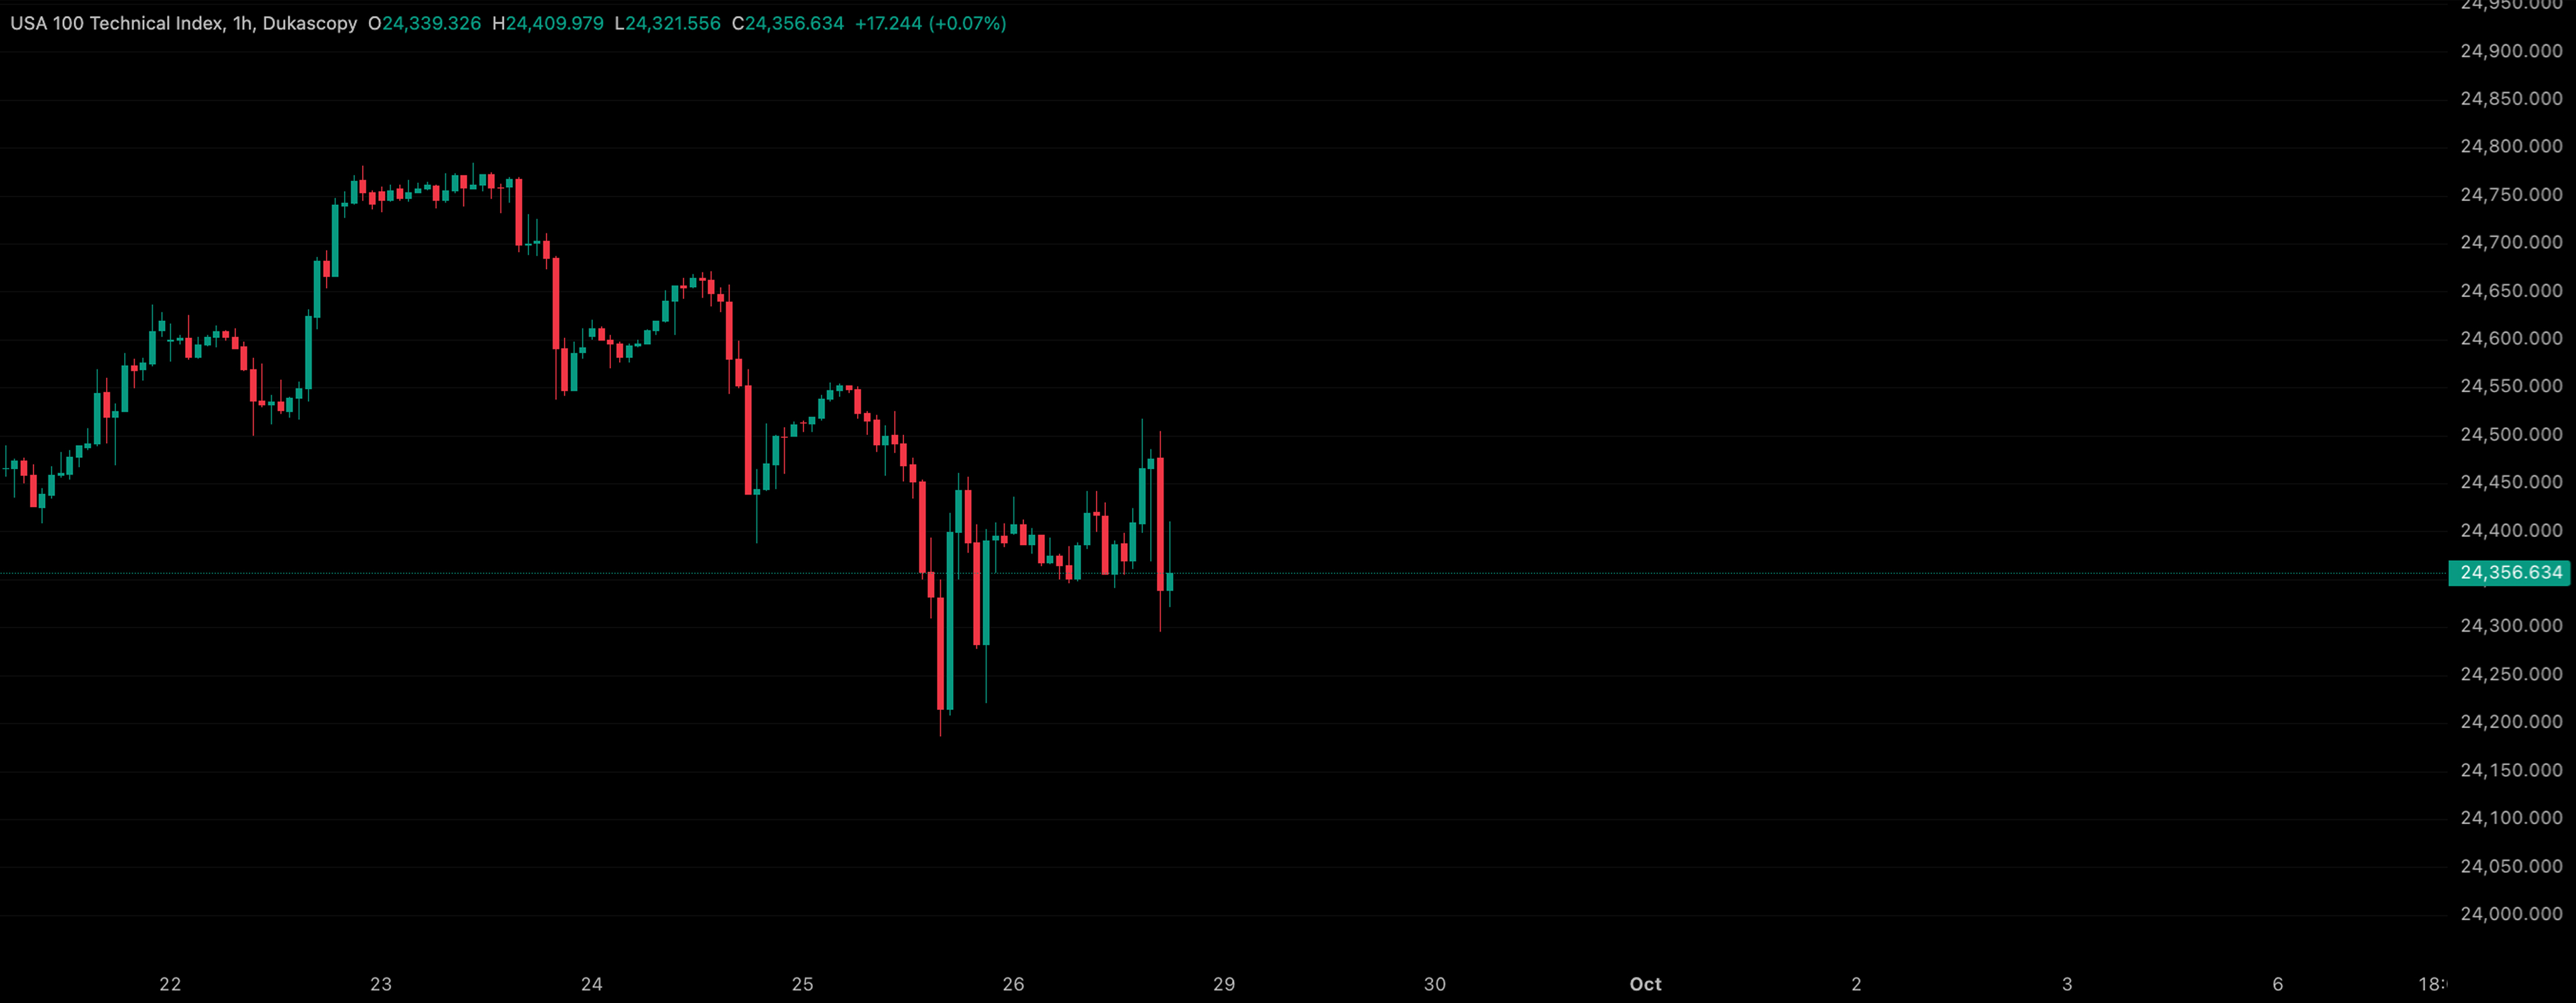
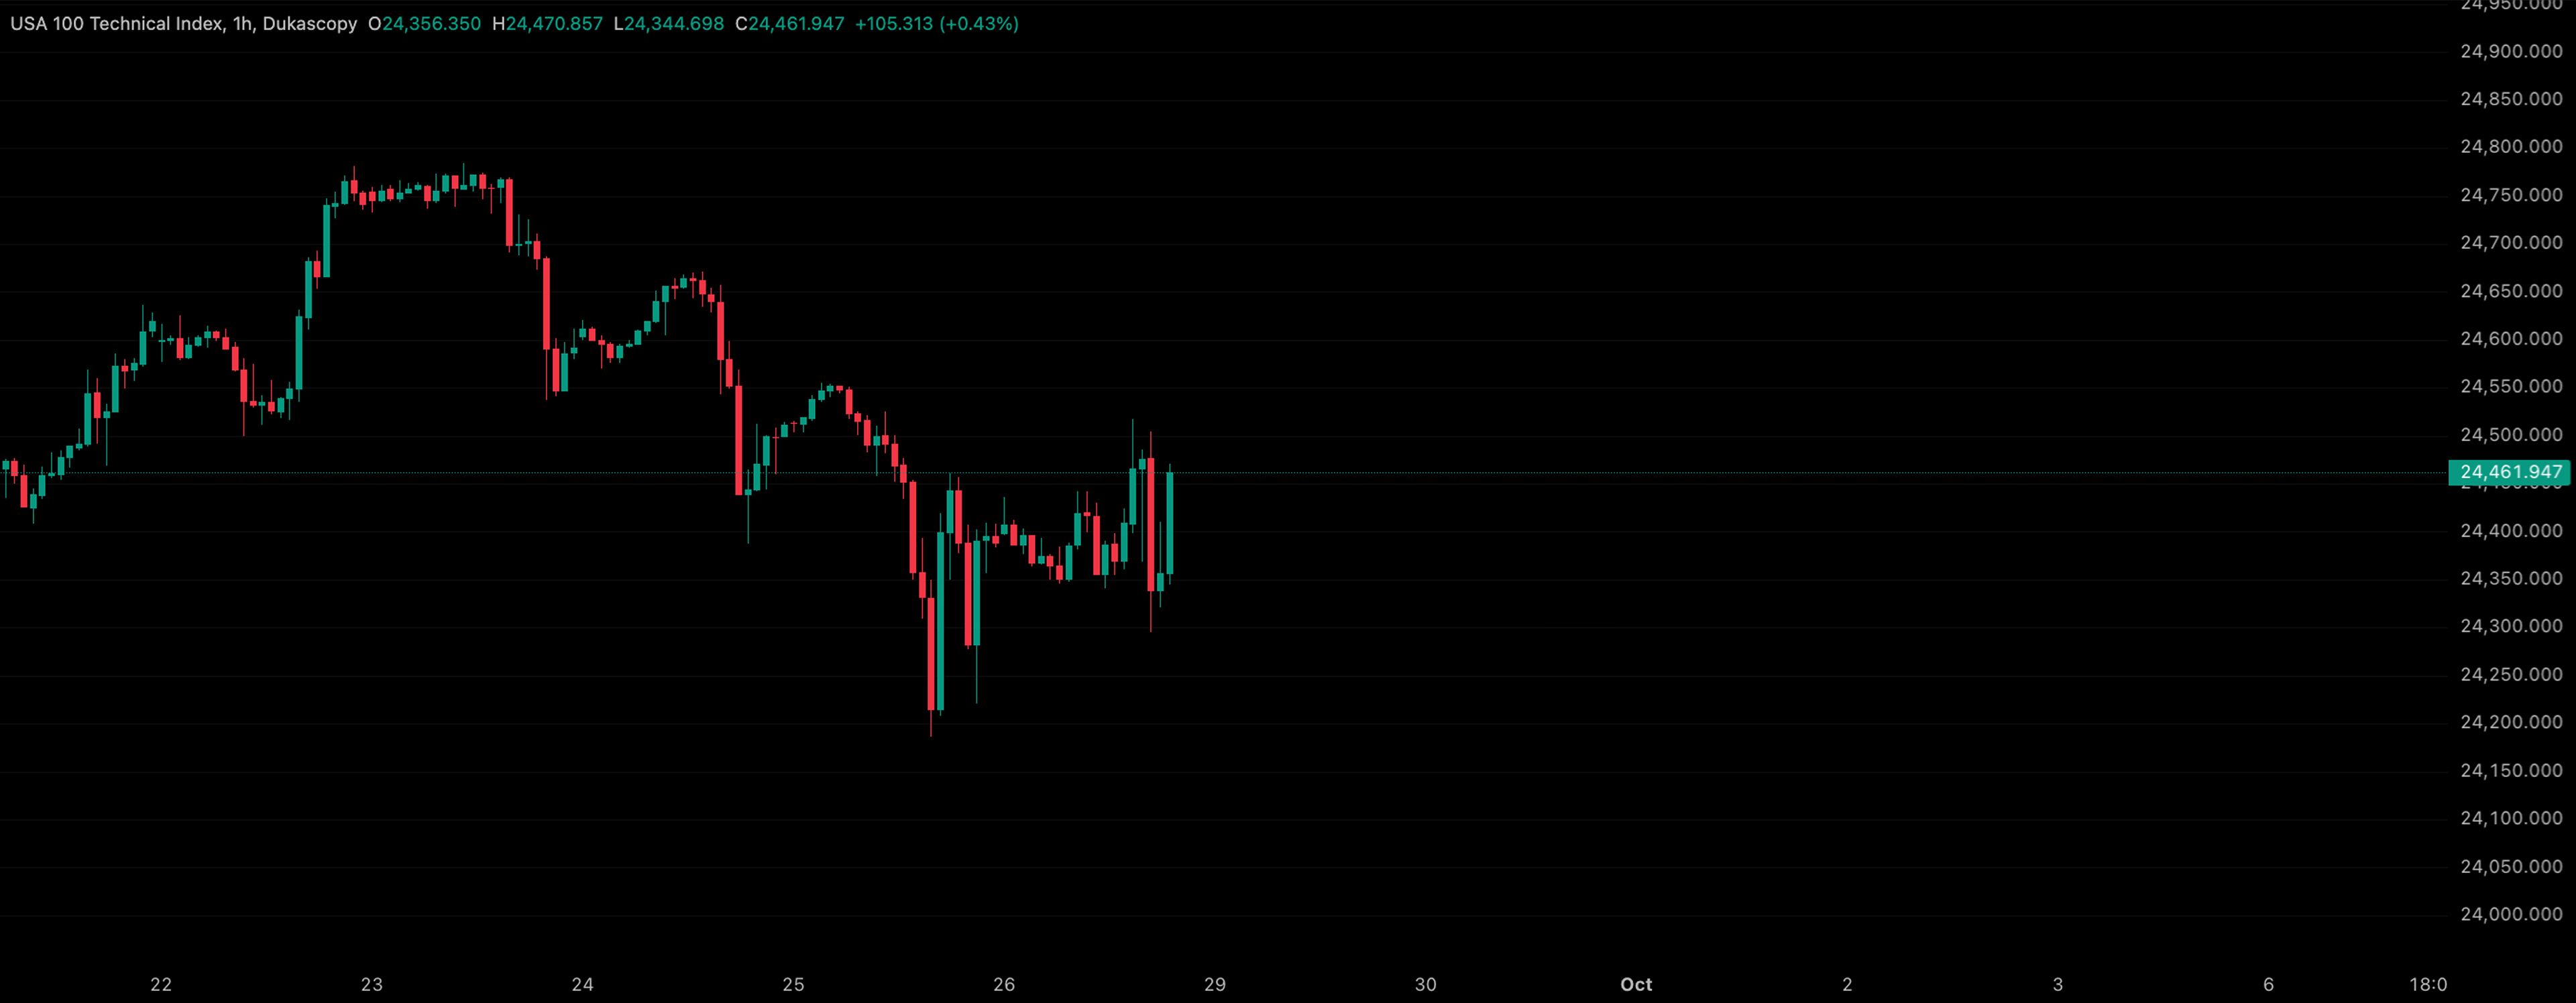
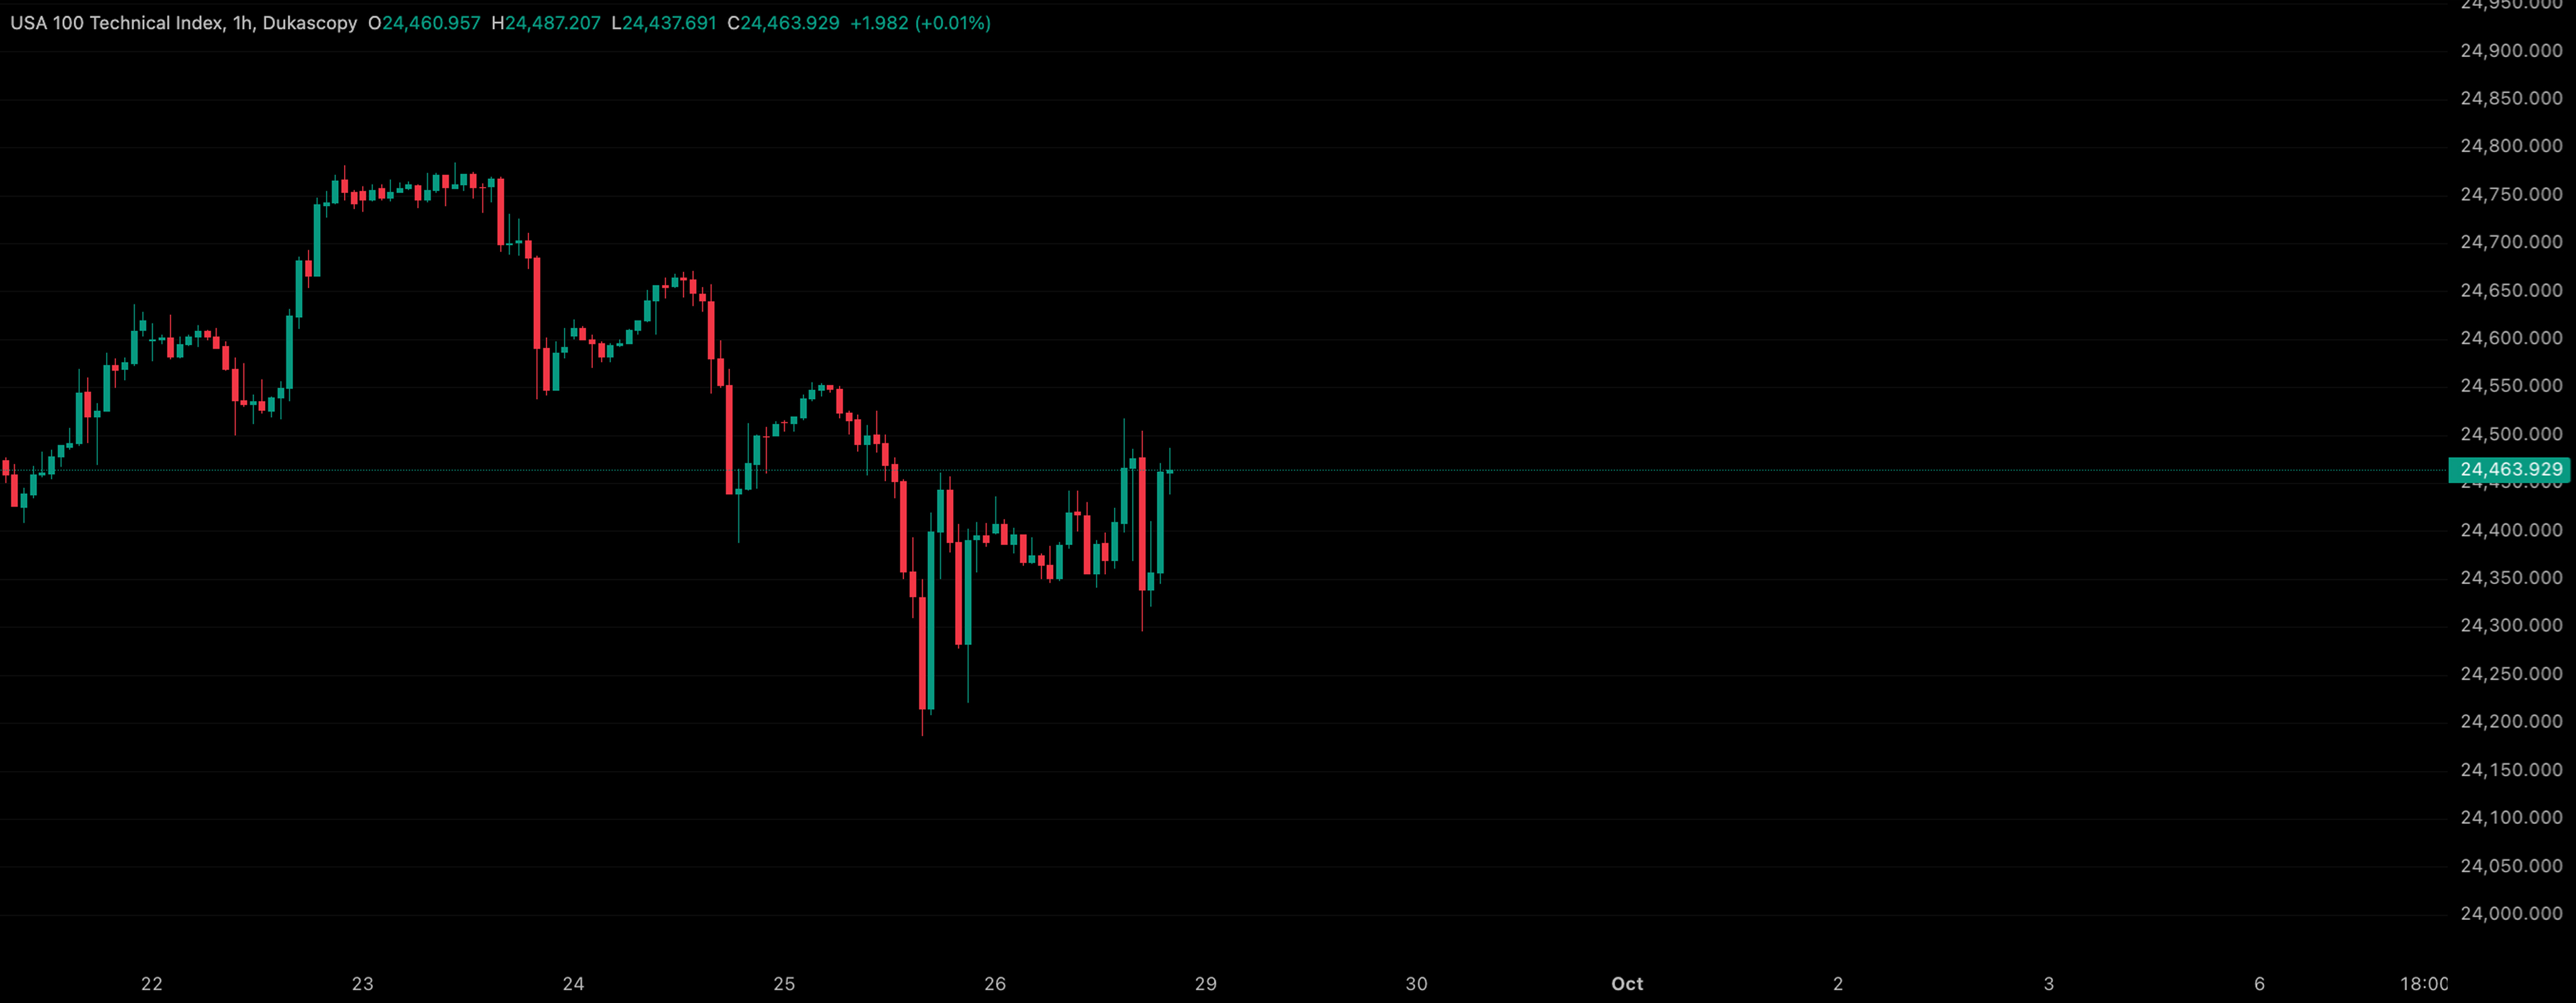
View moreThe best way to replay any marketReplay your favorite asset bar by bar
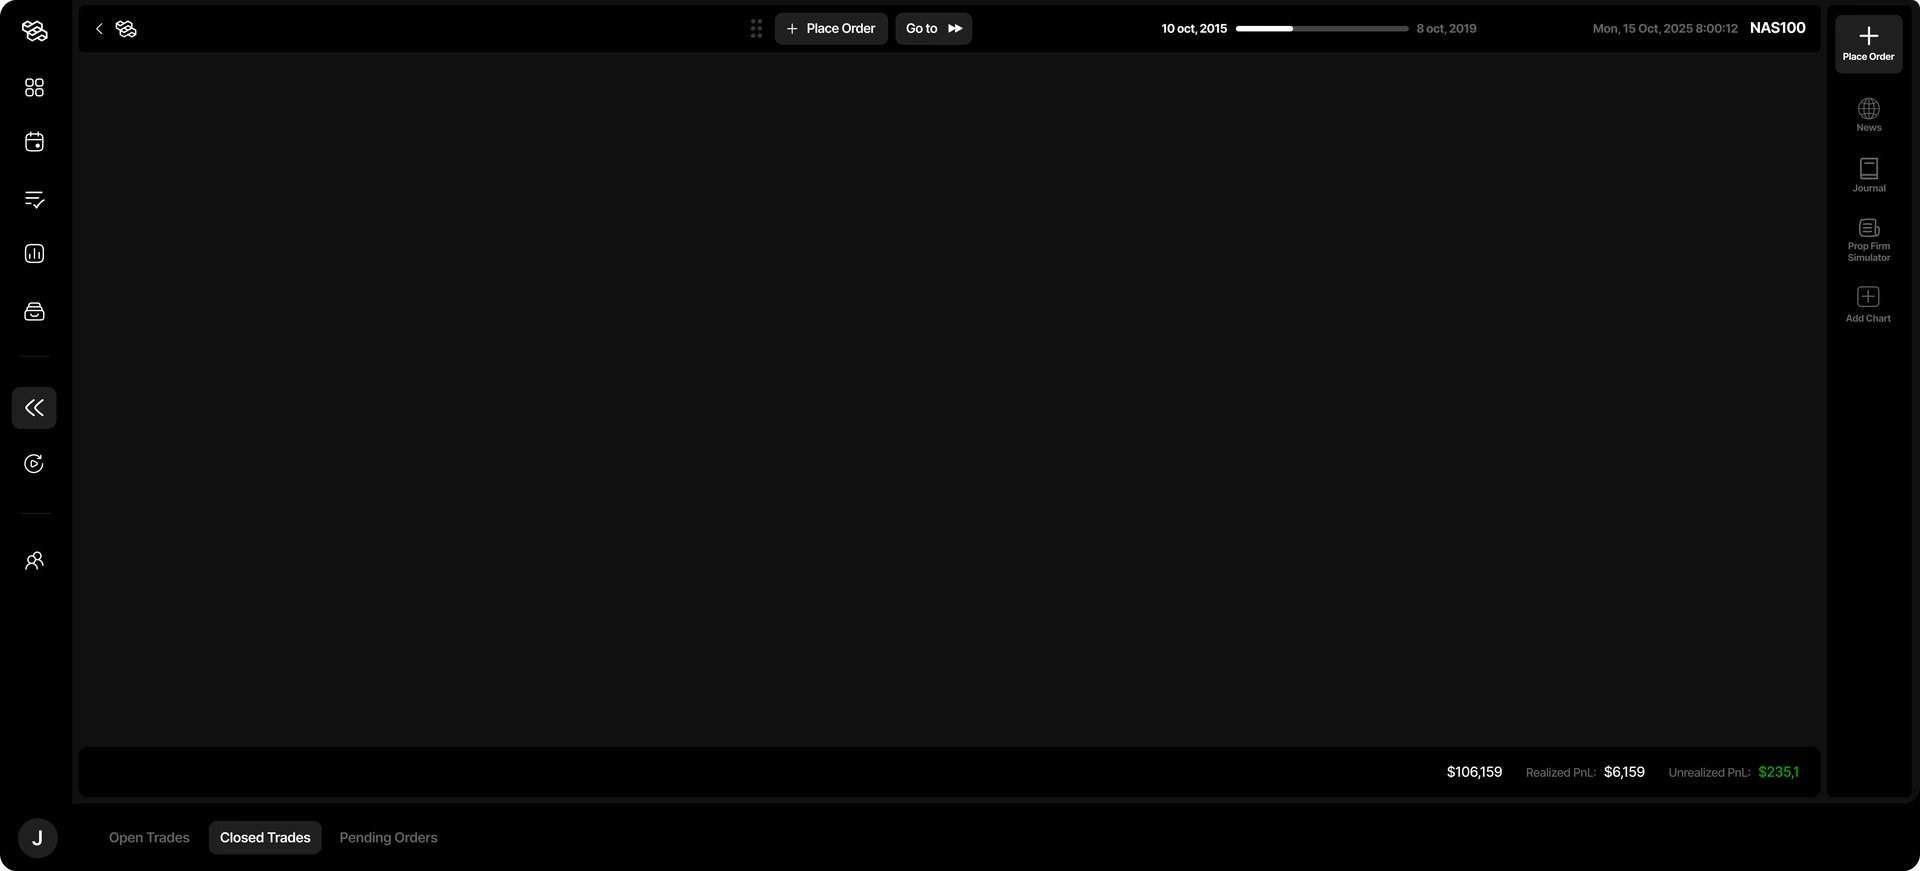
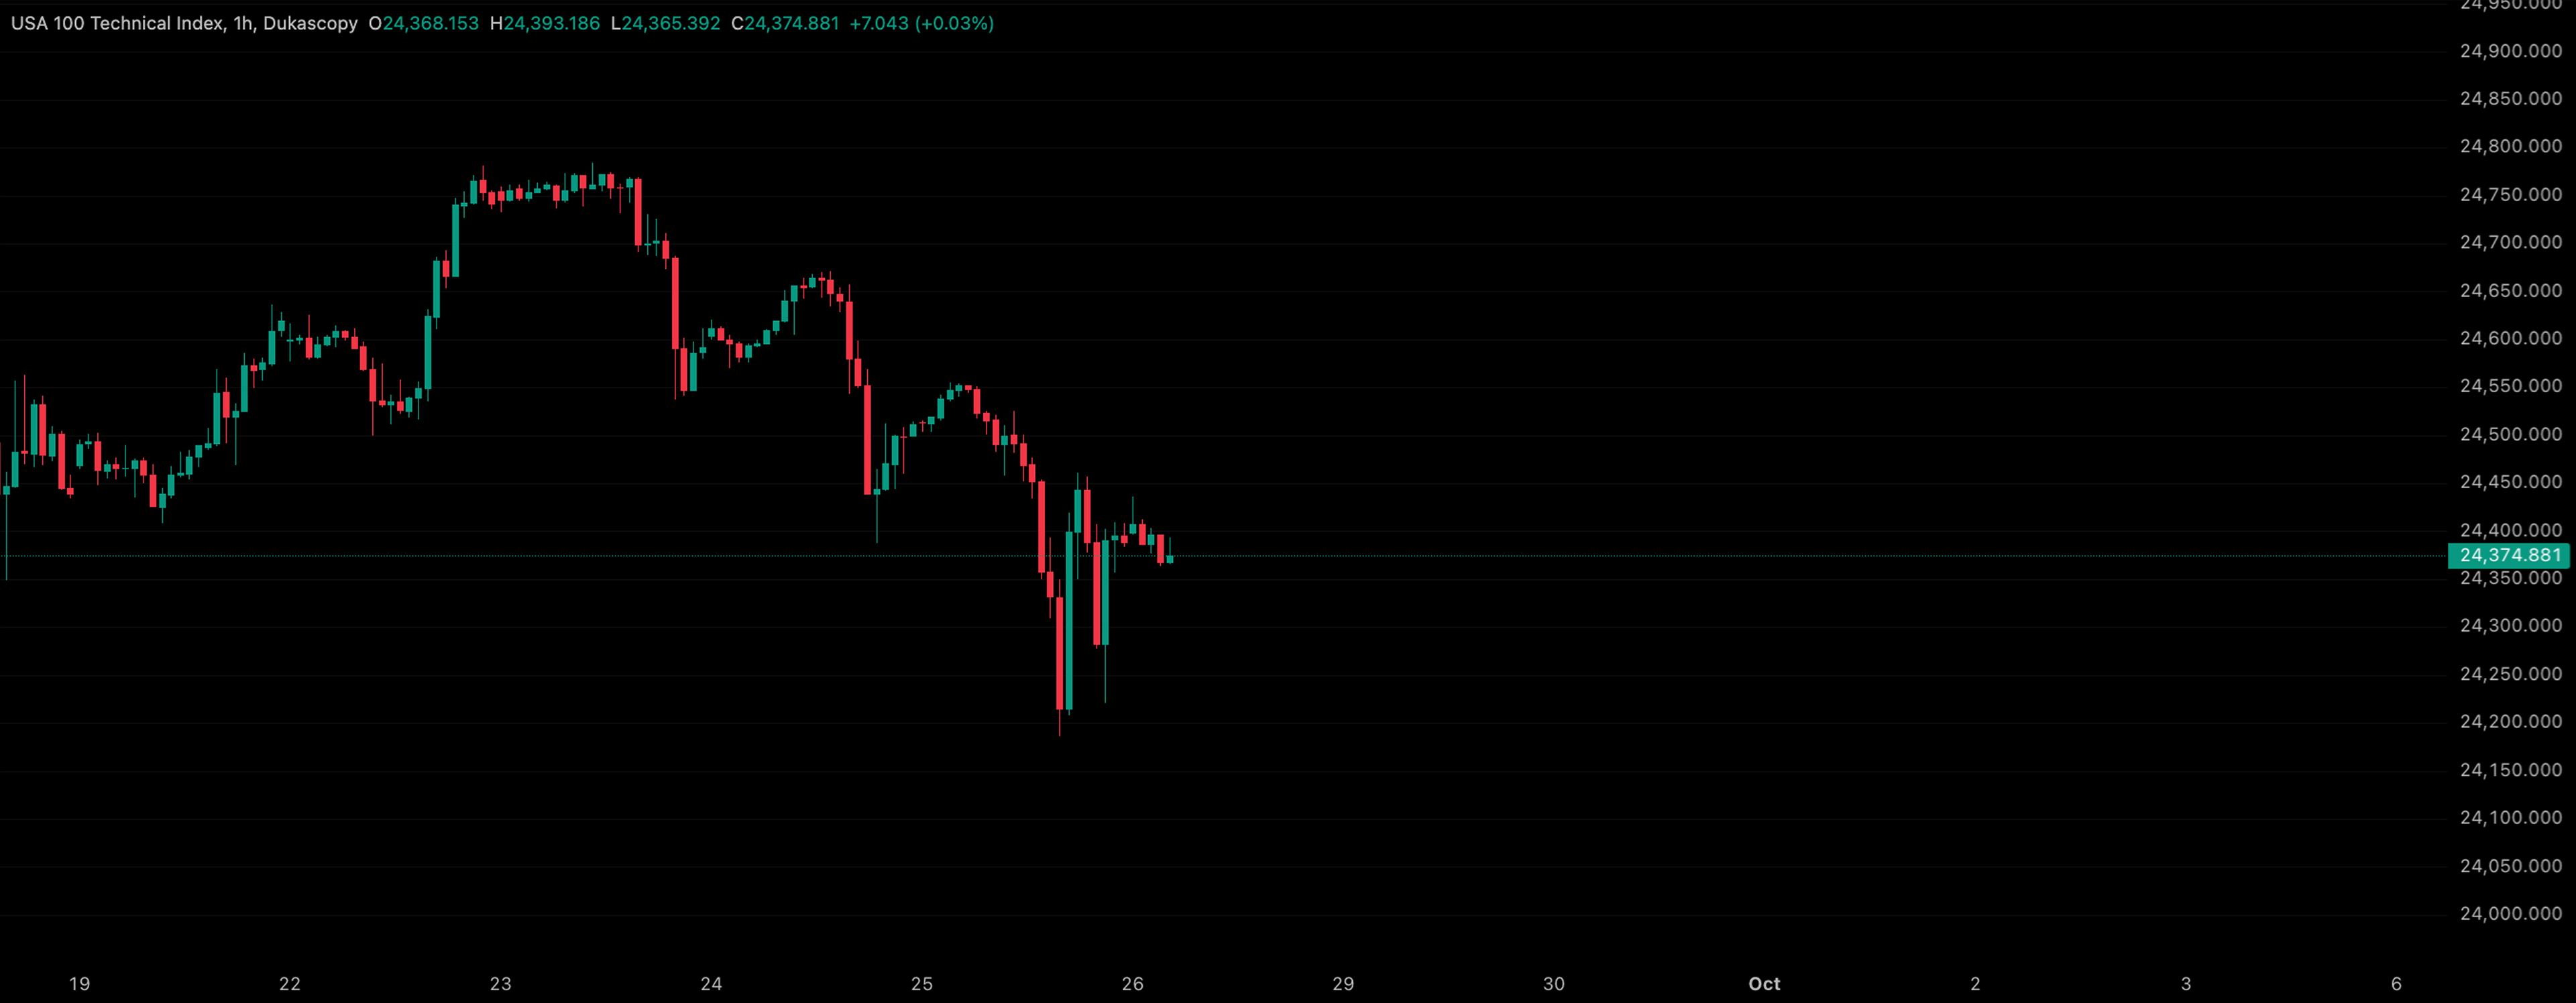
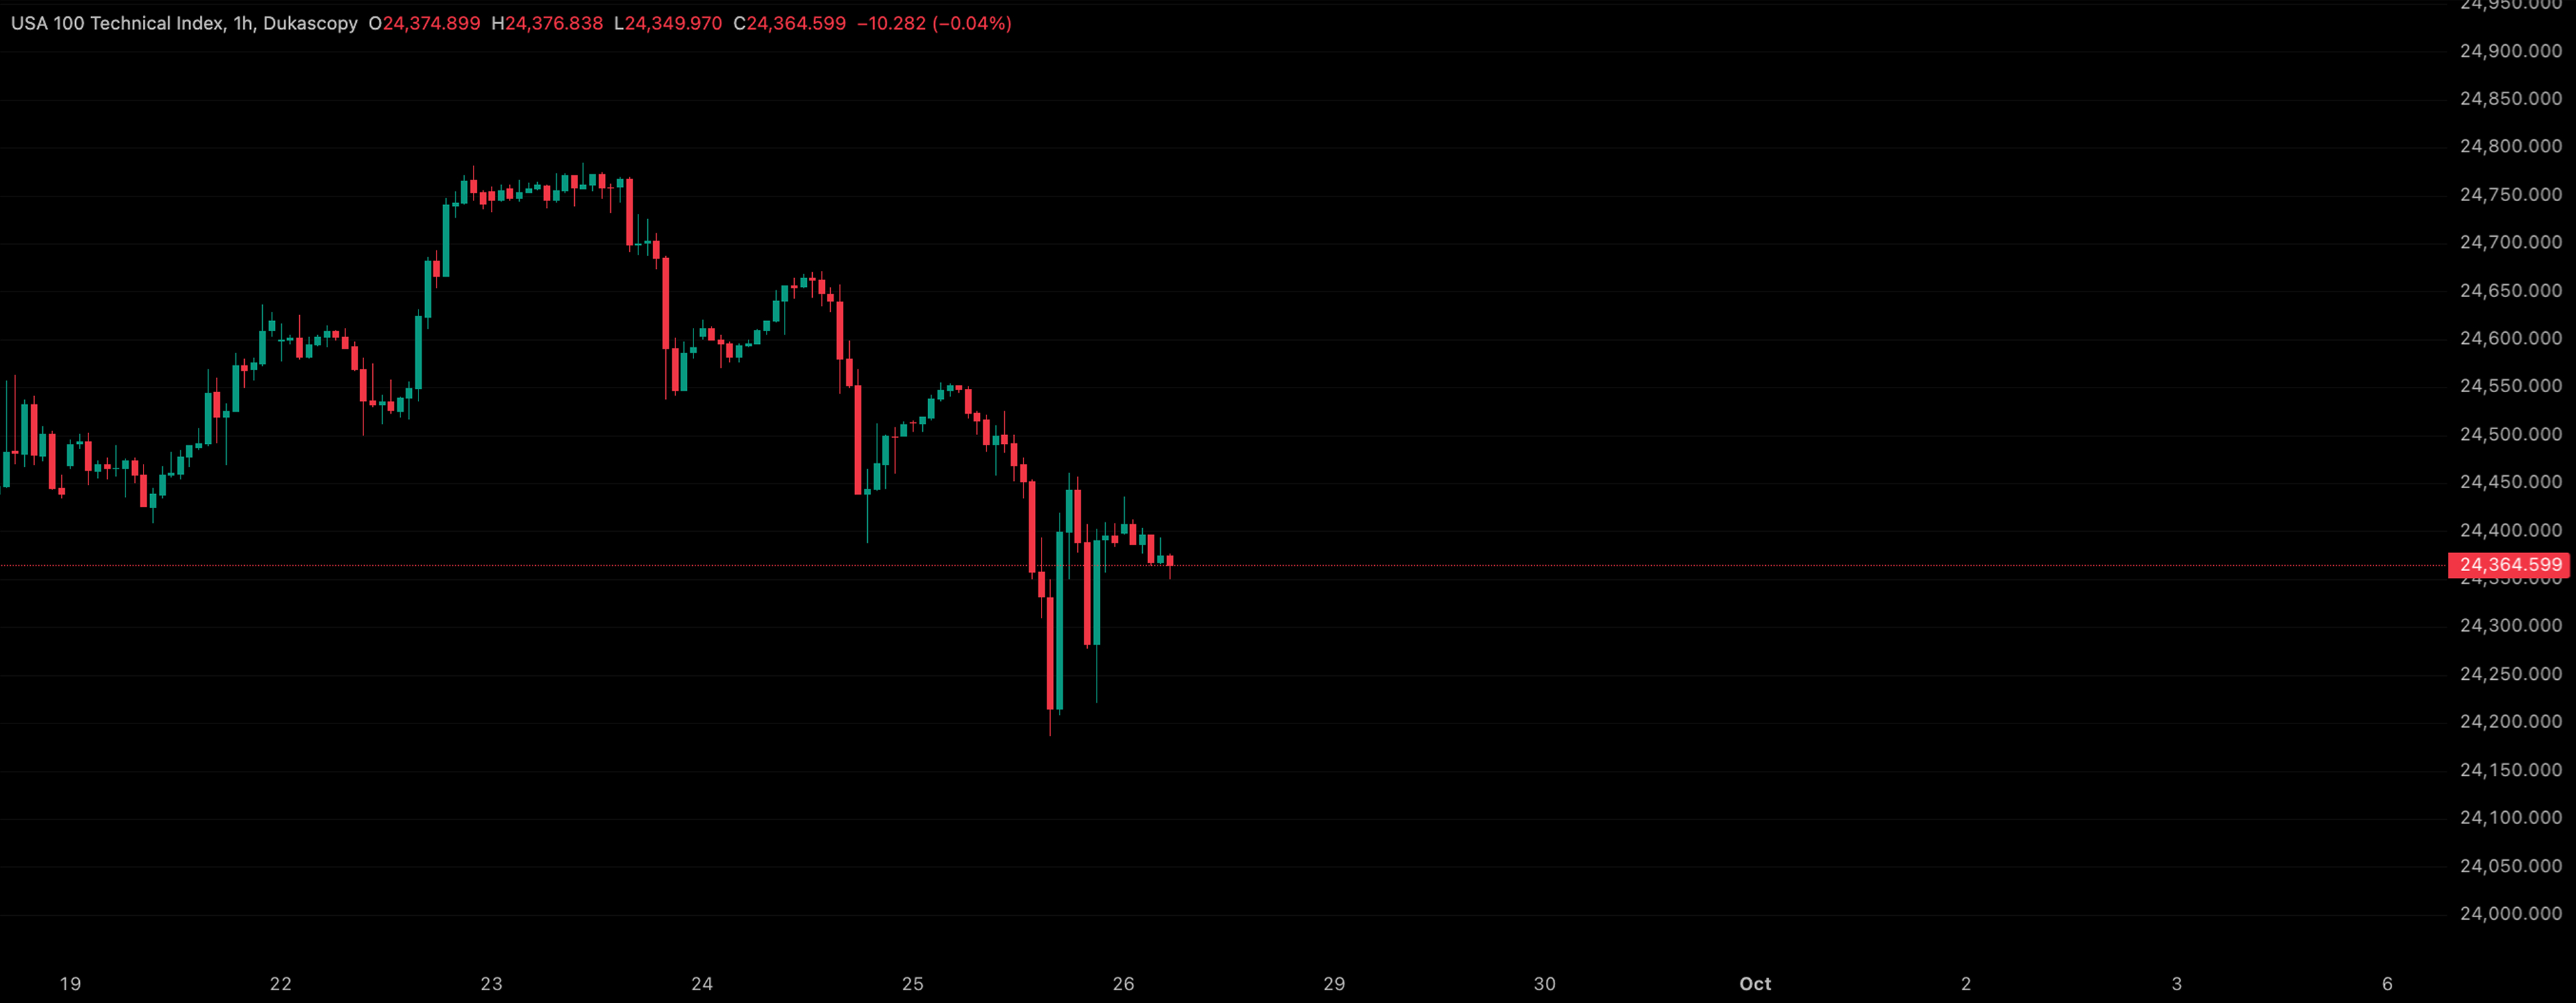
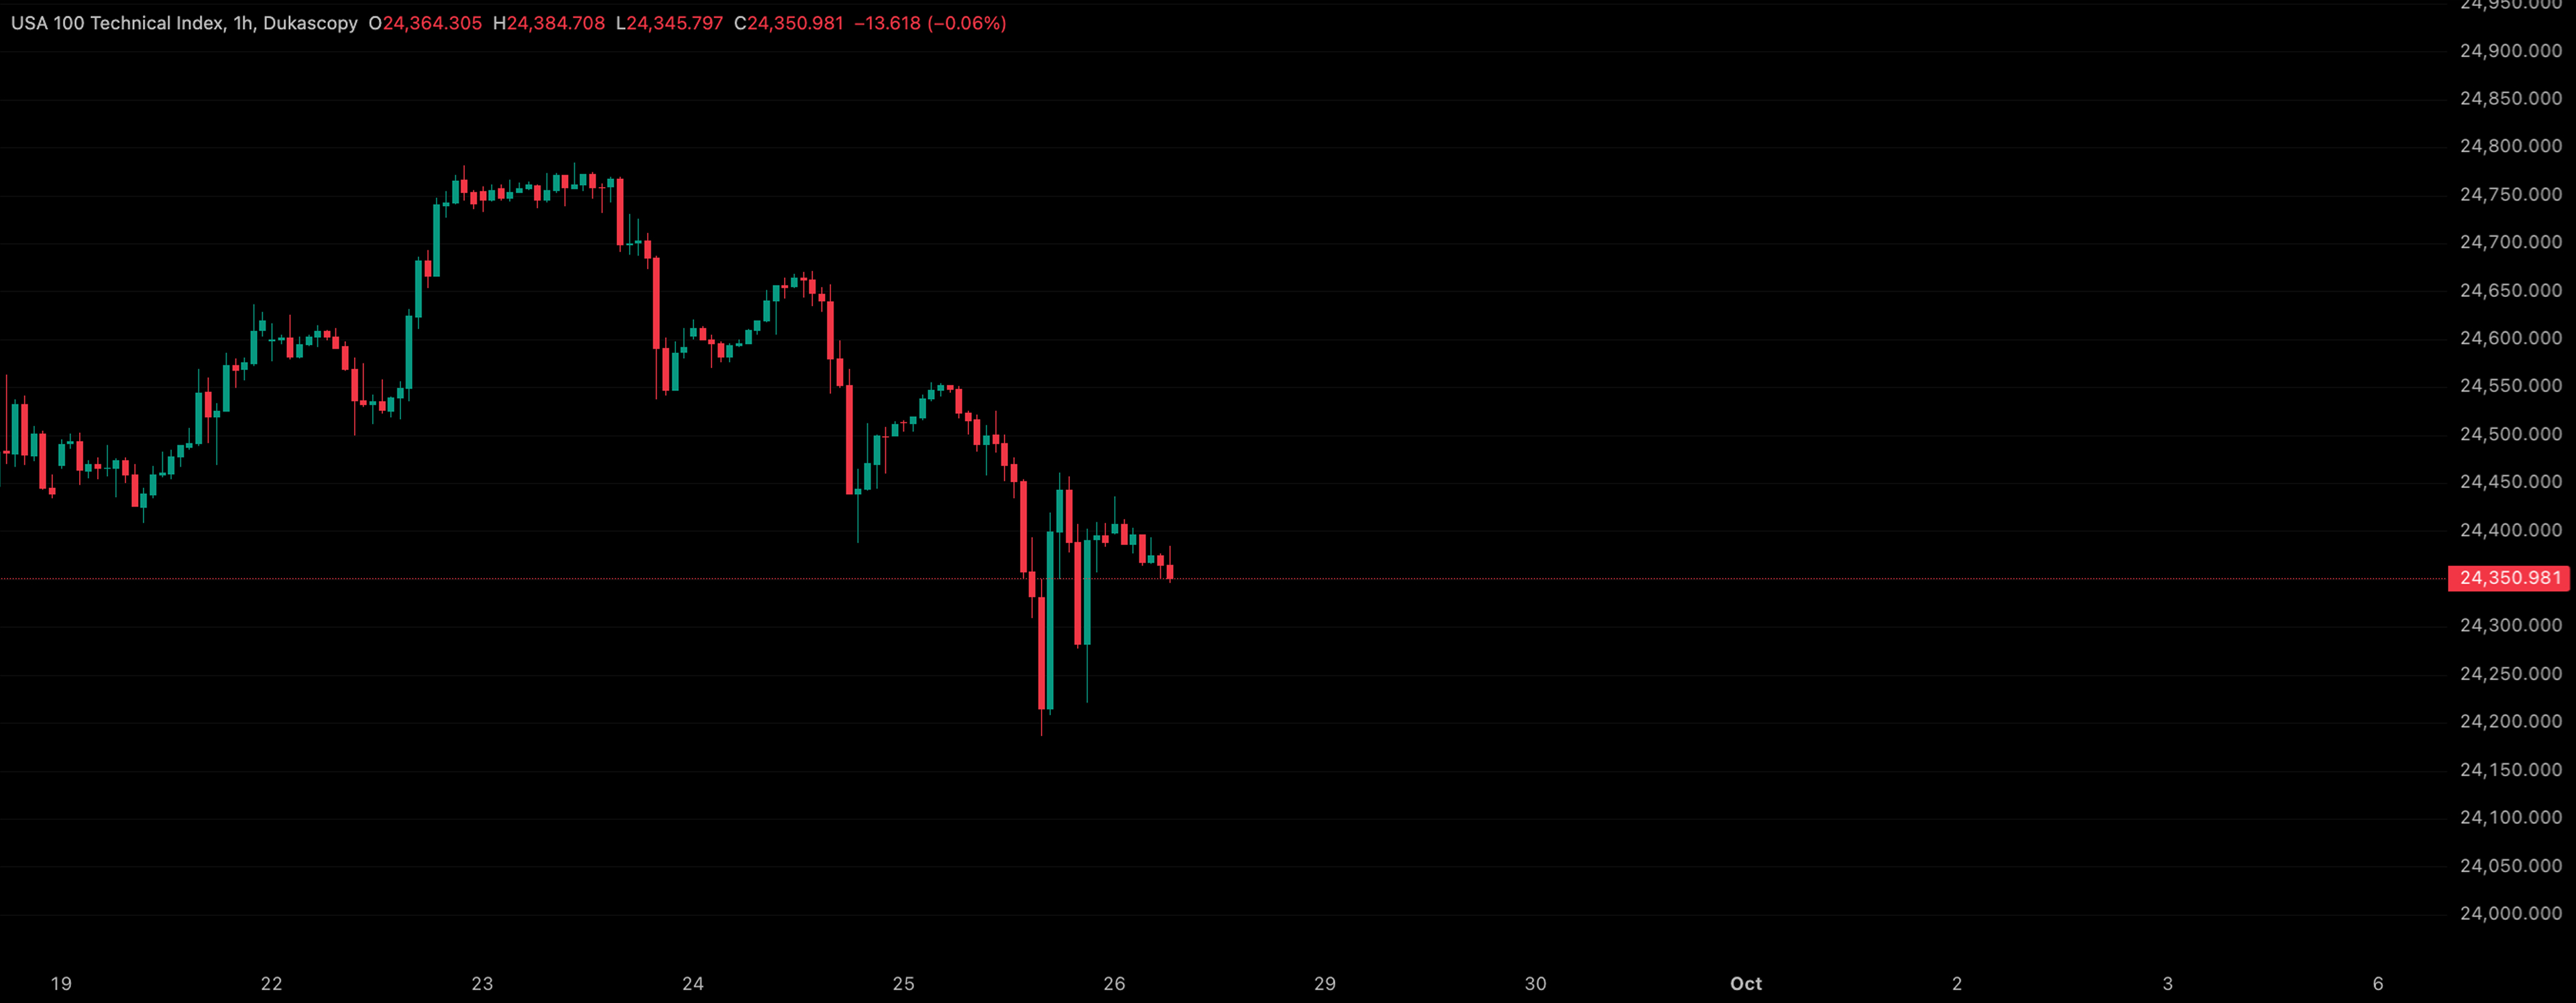
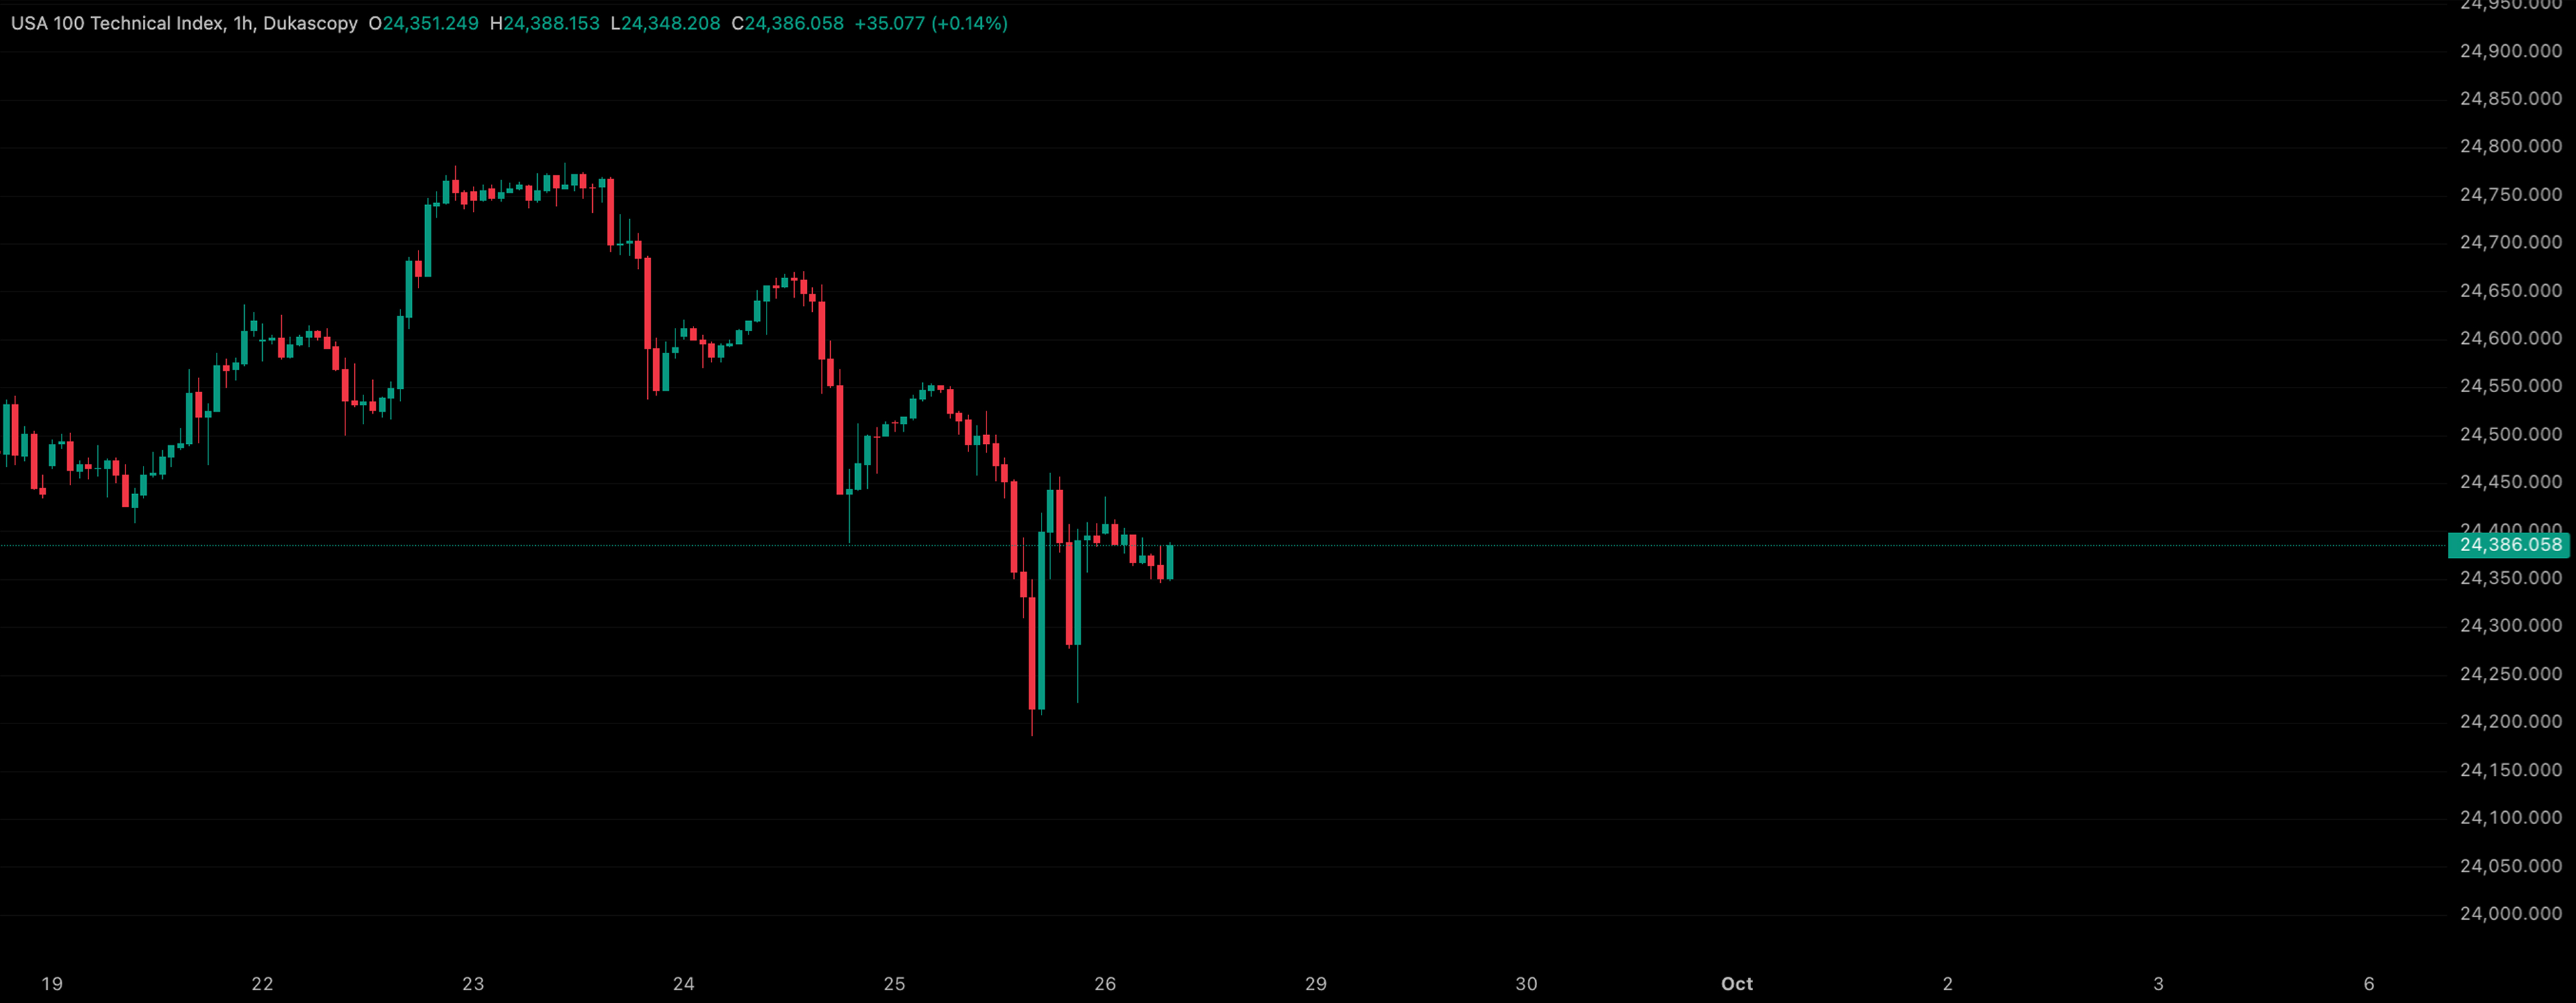
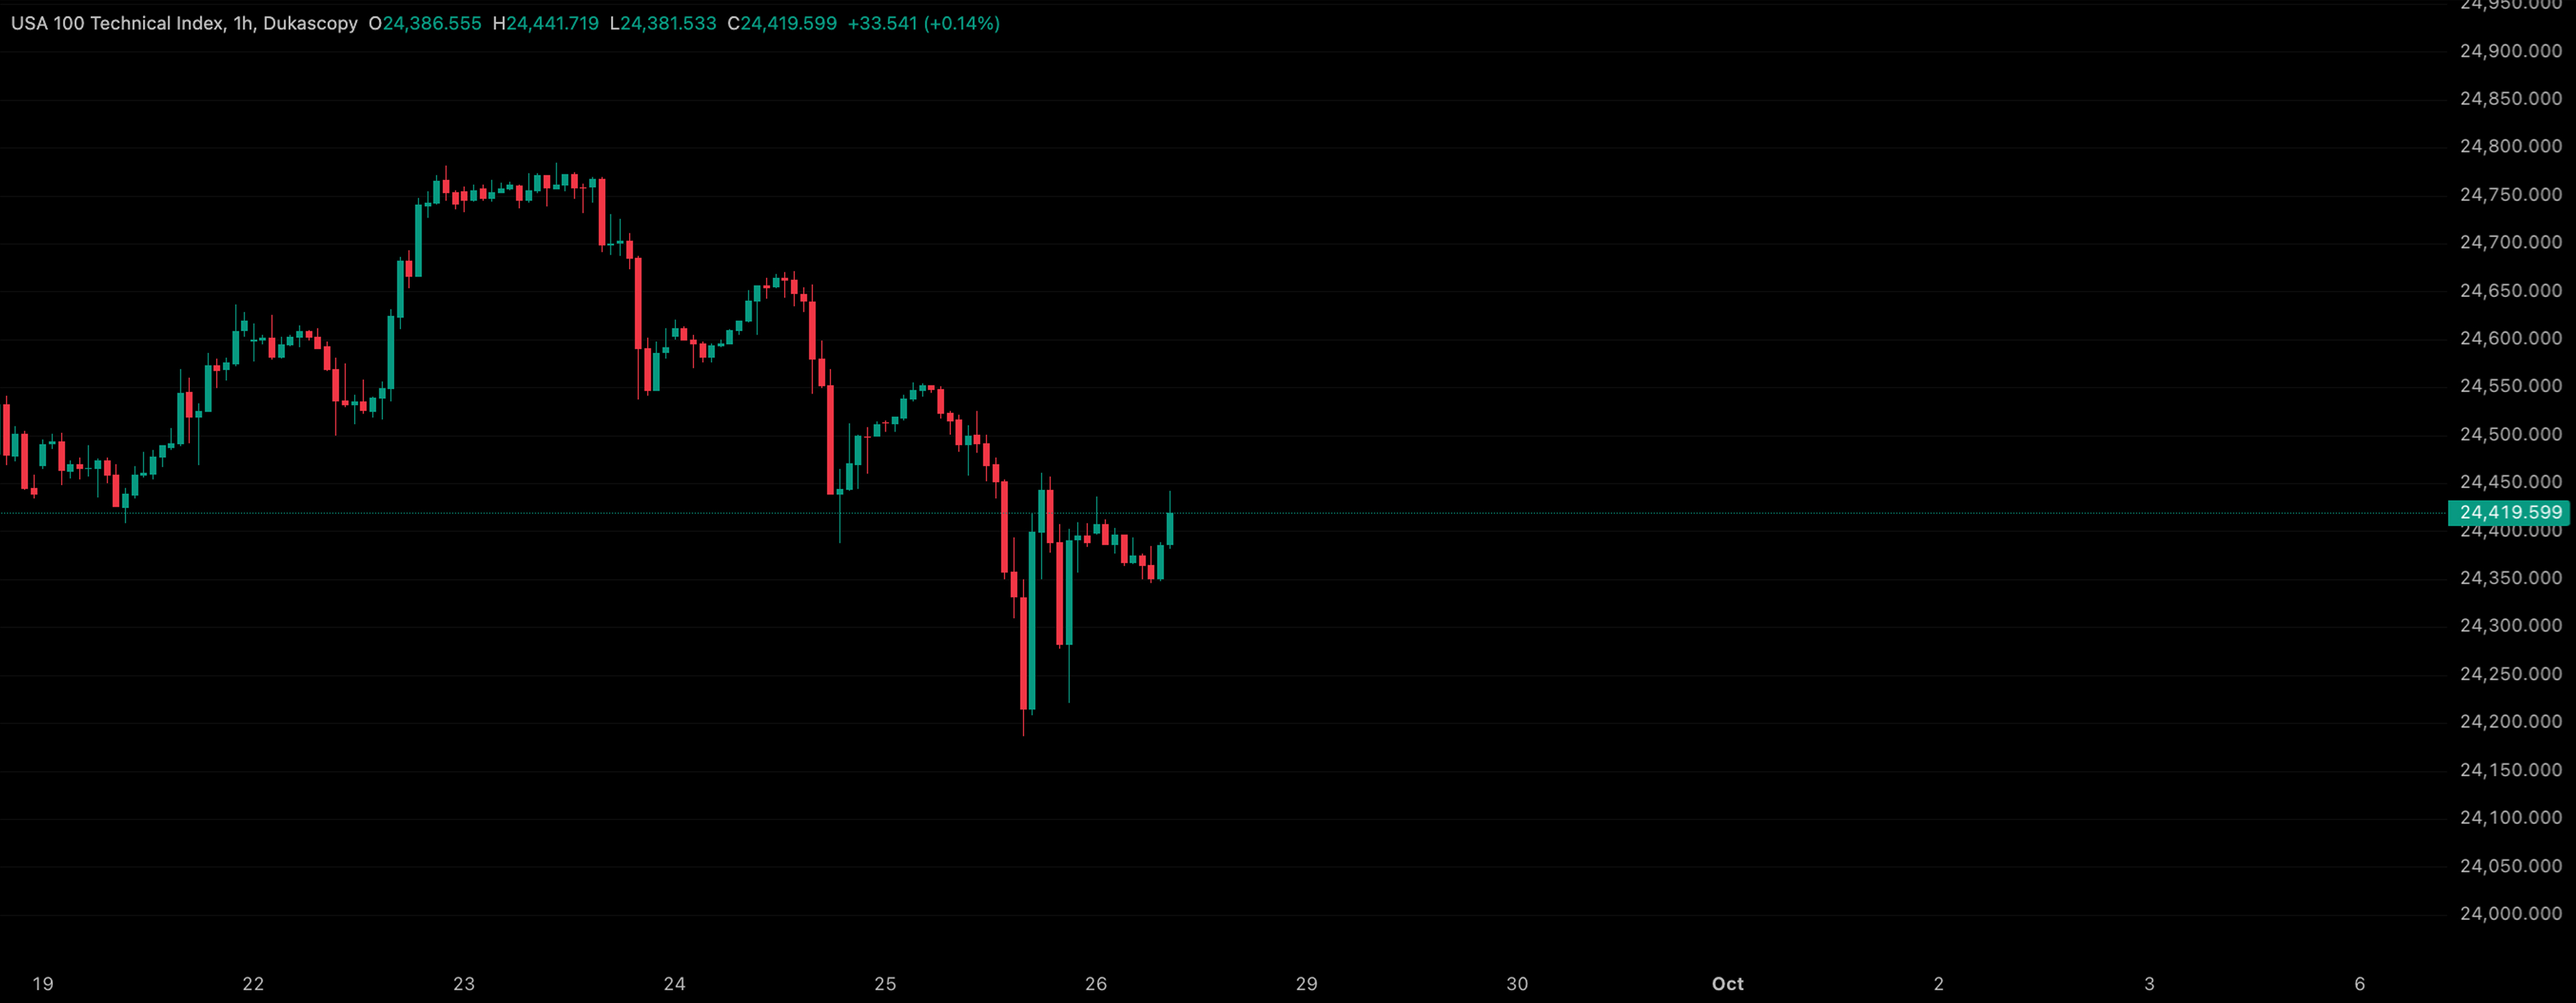
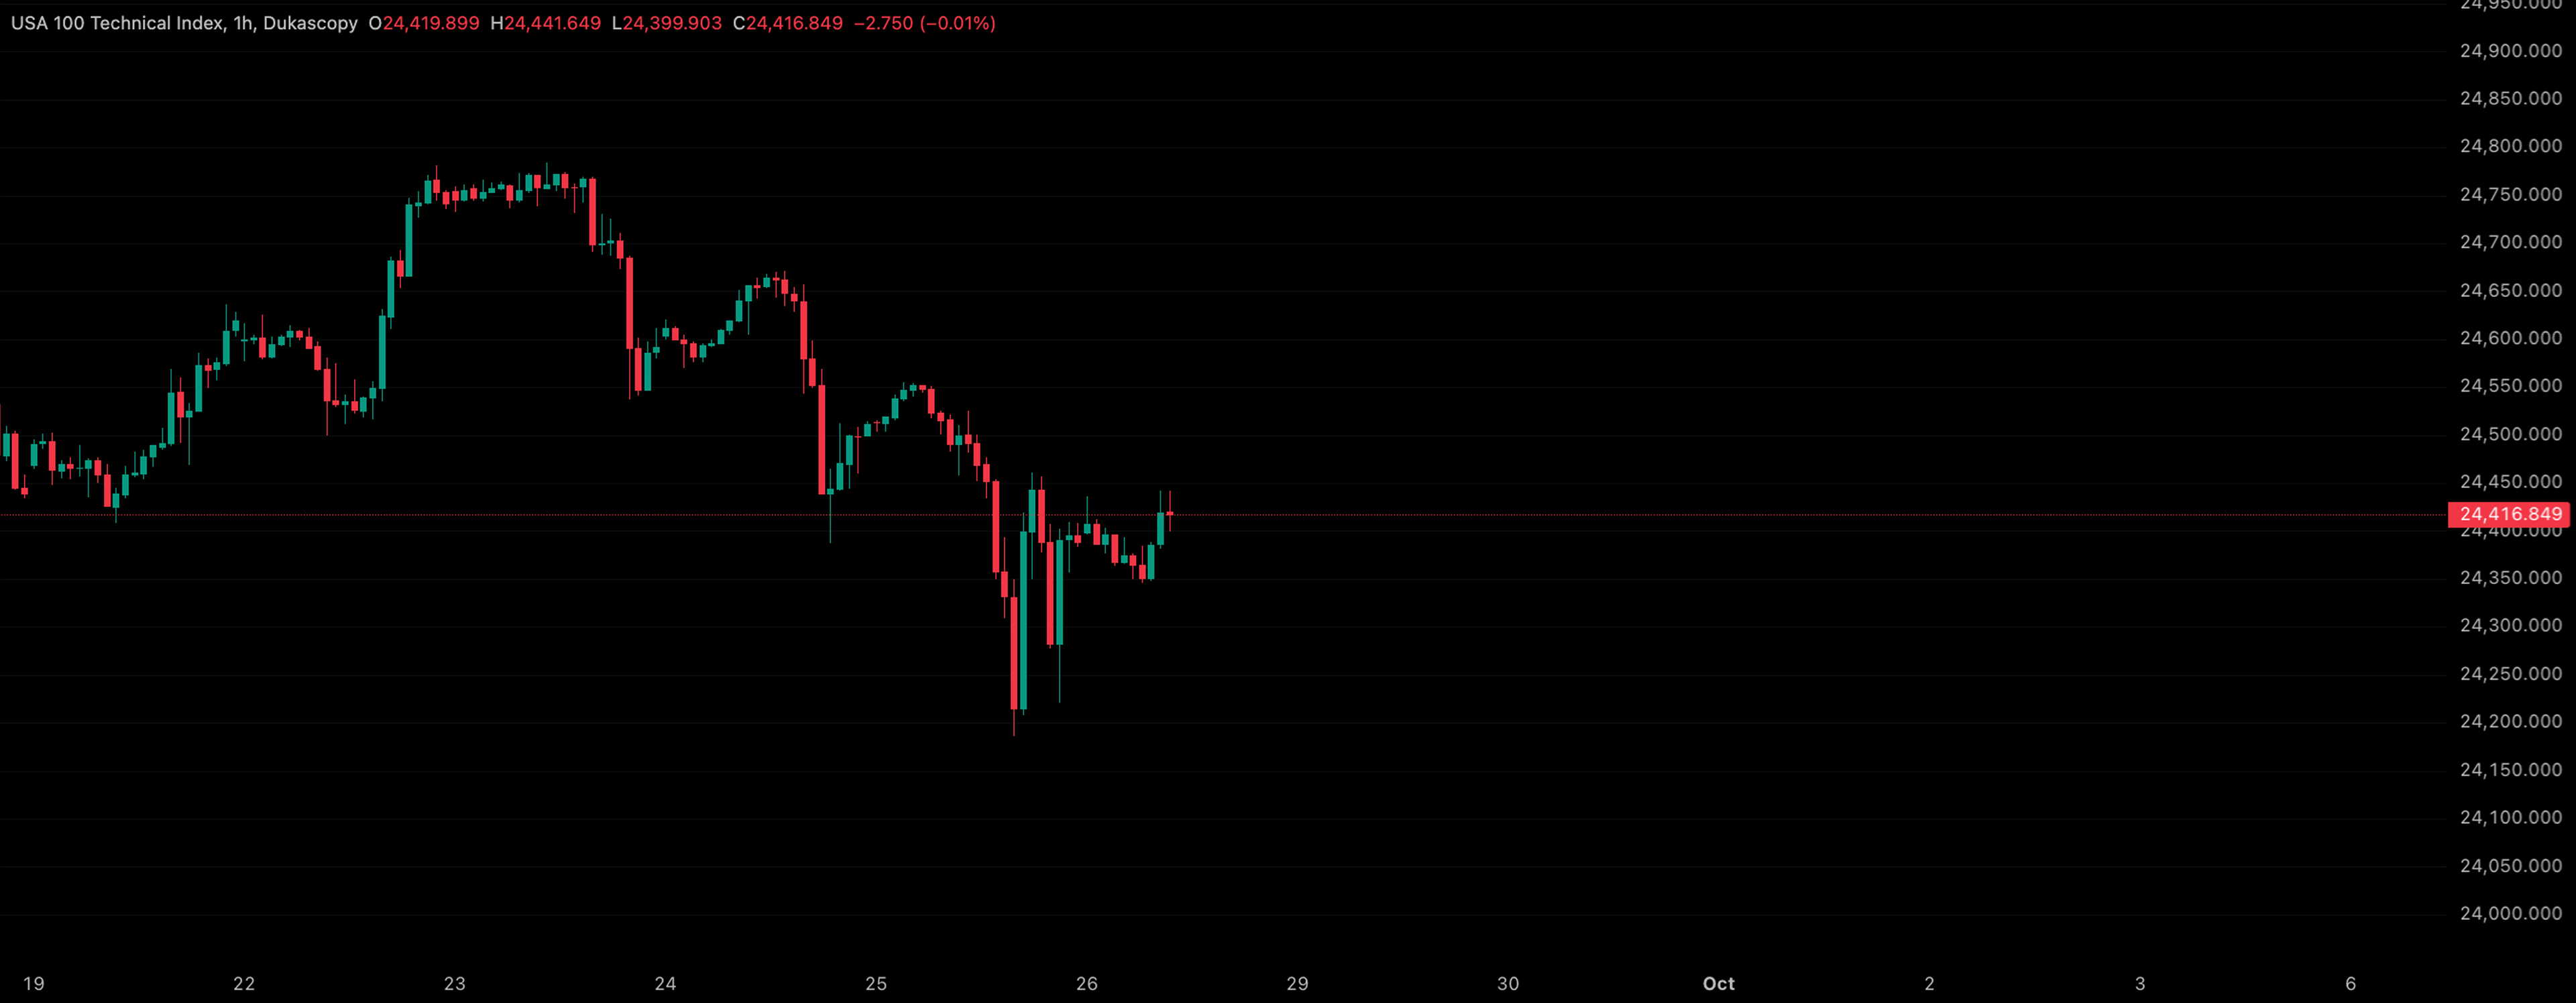
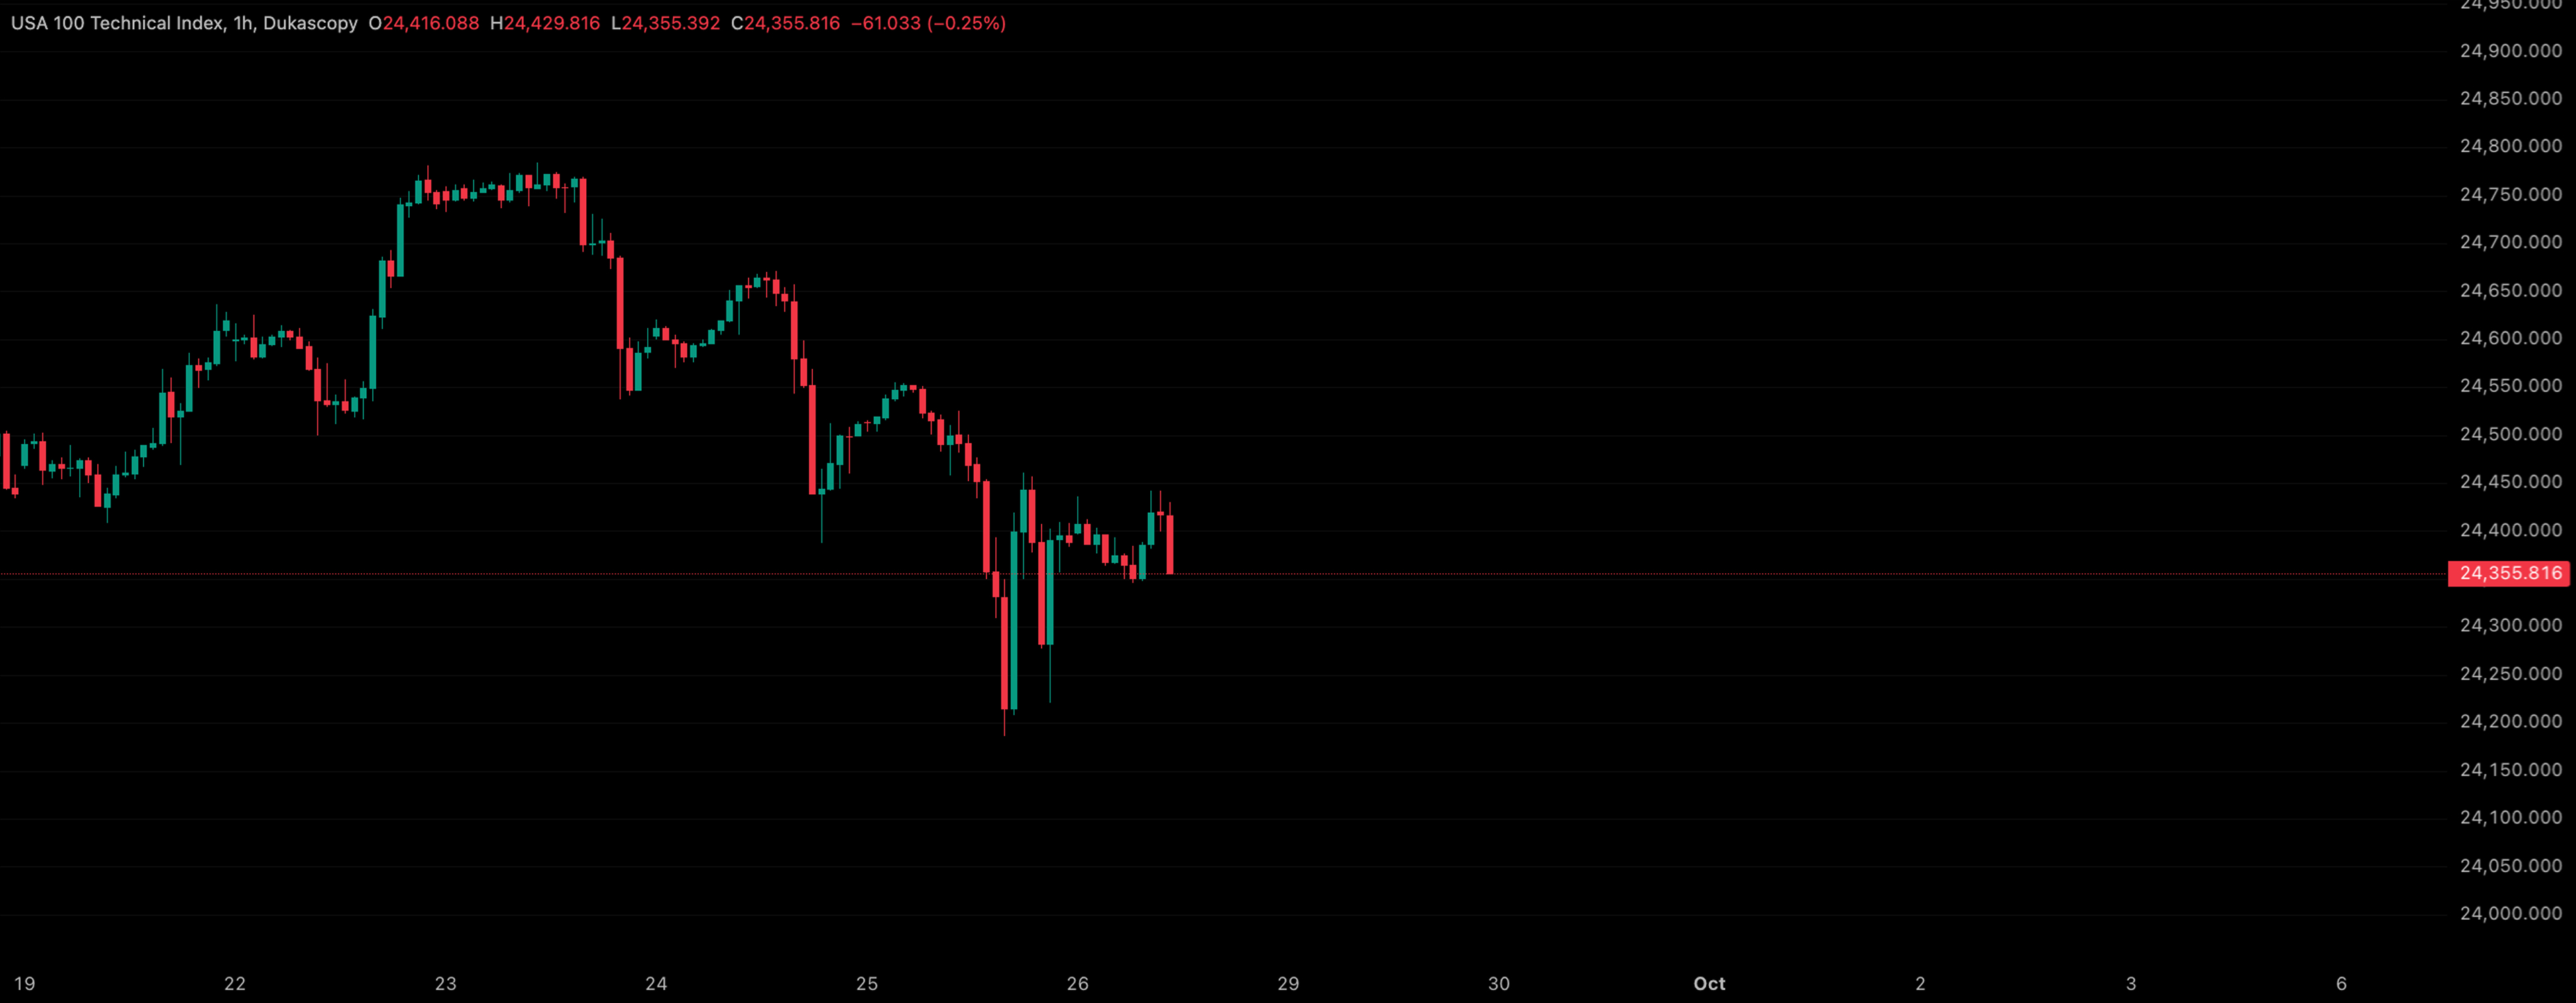
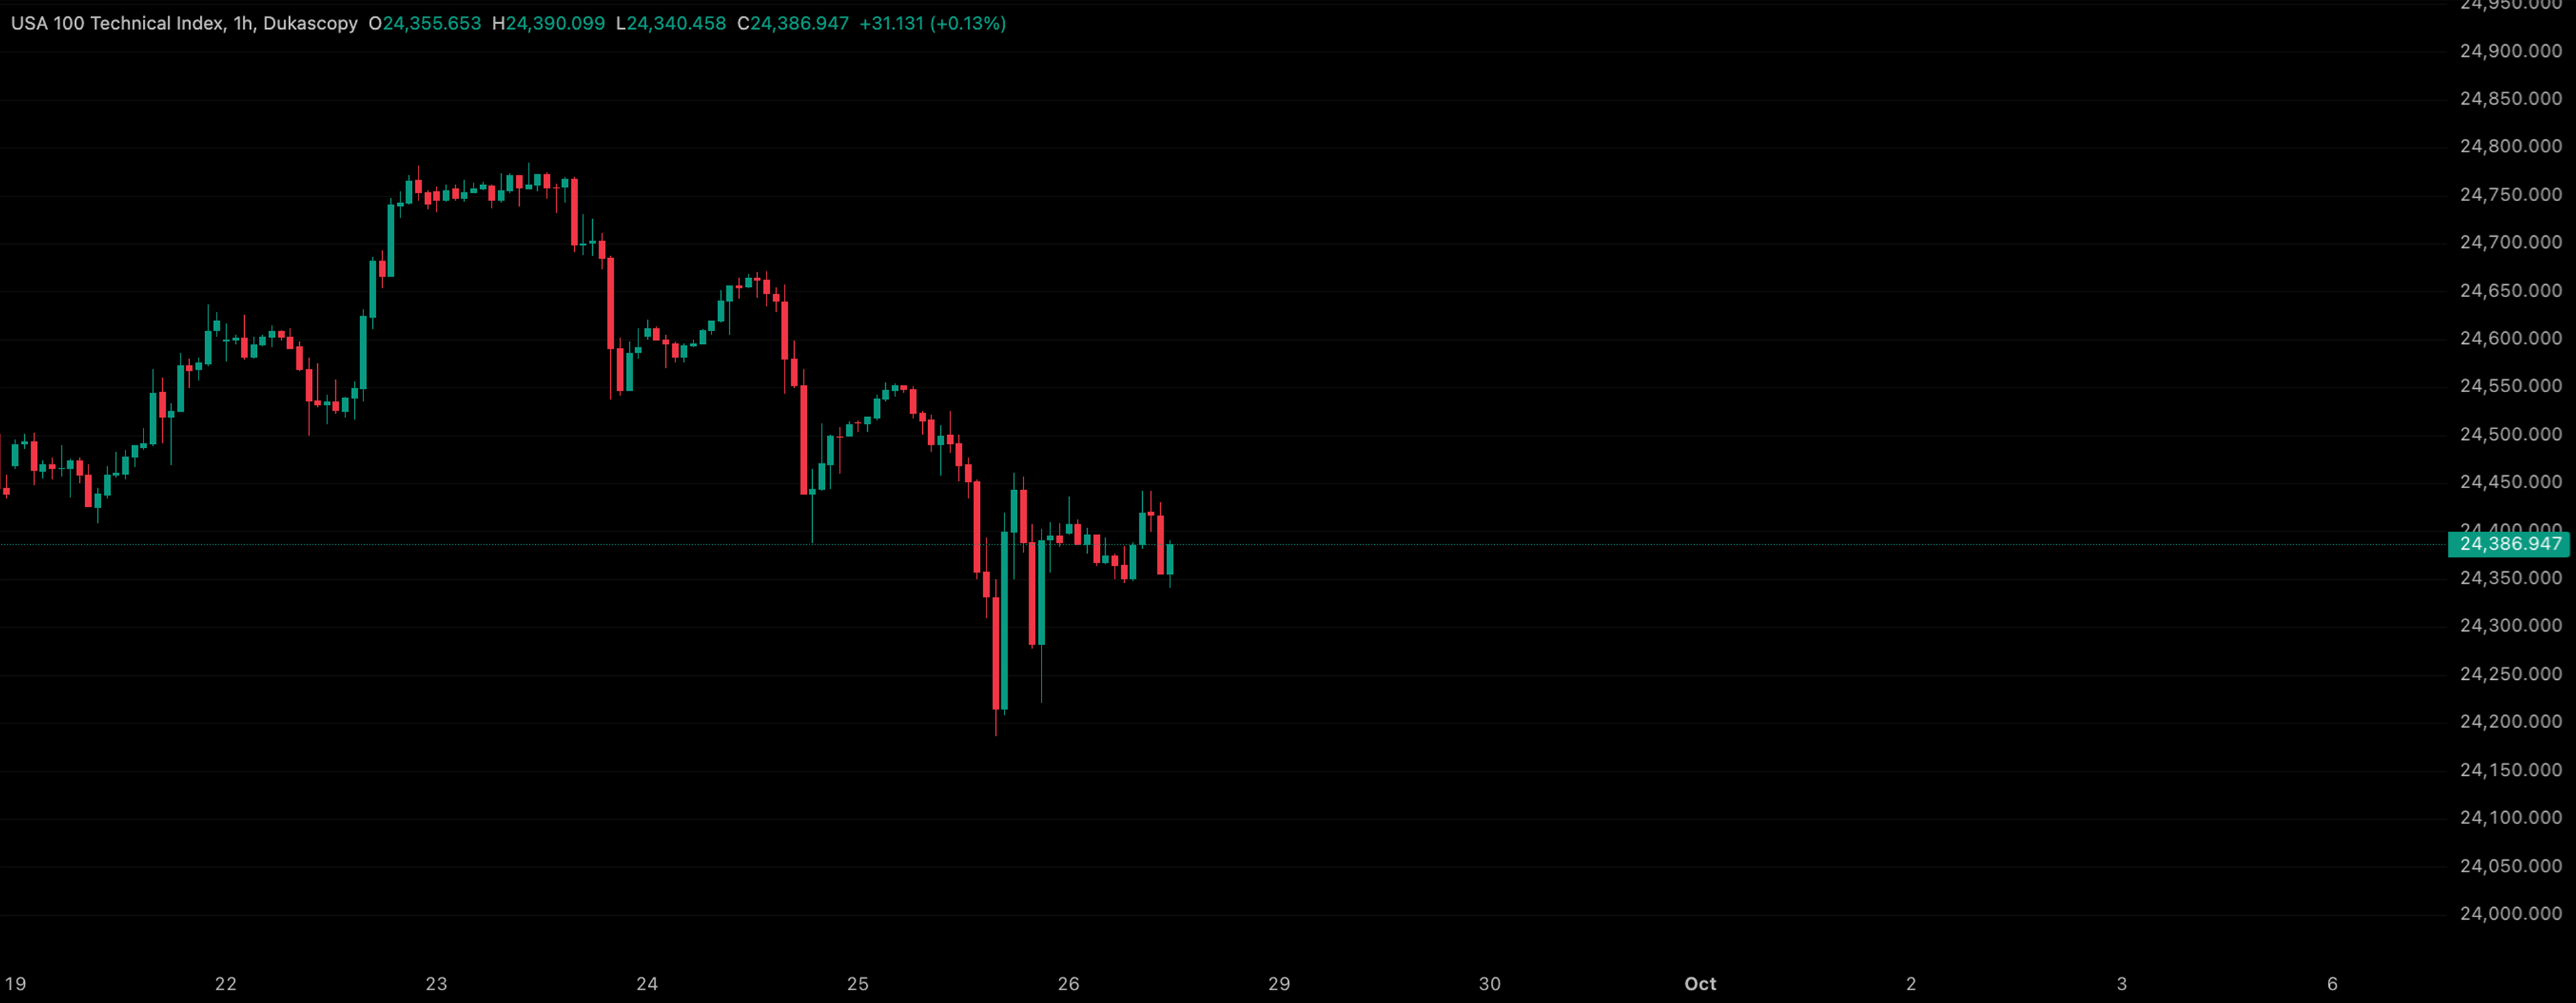

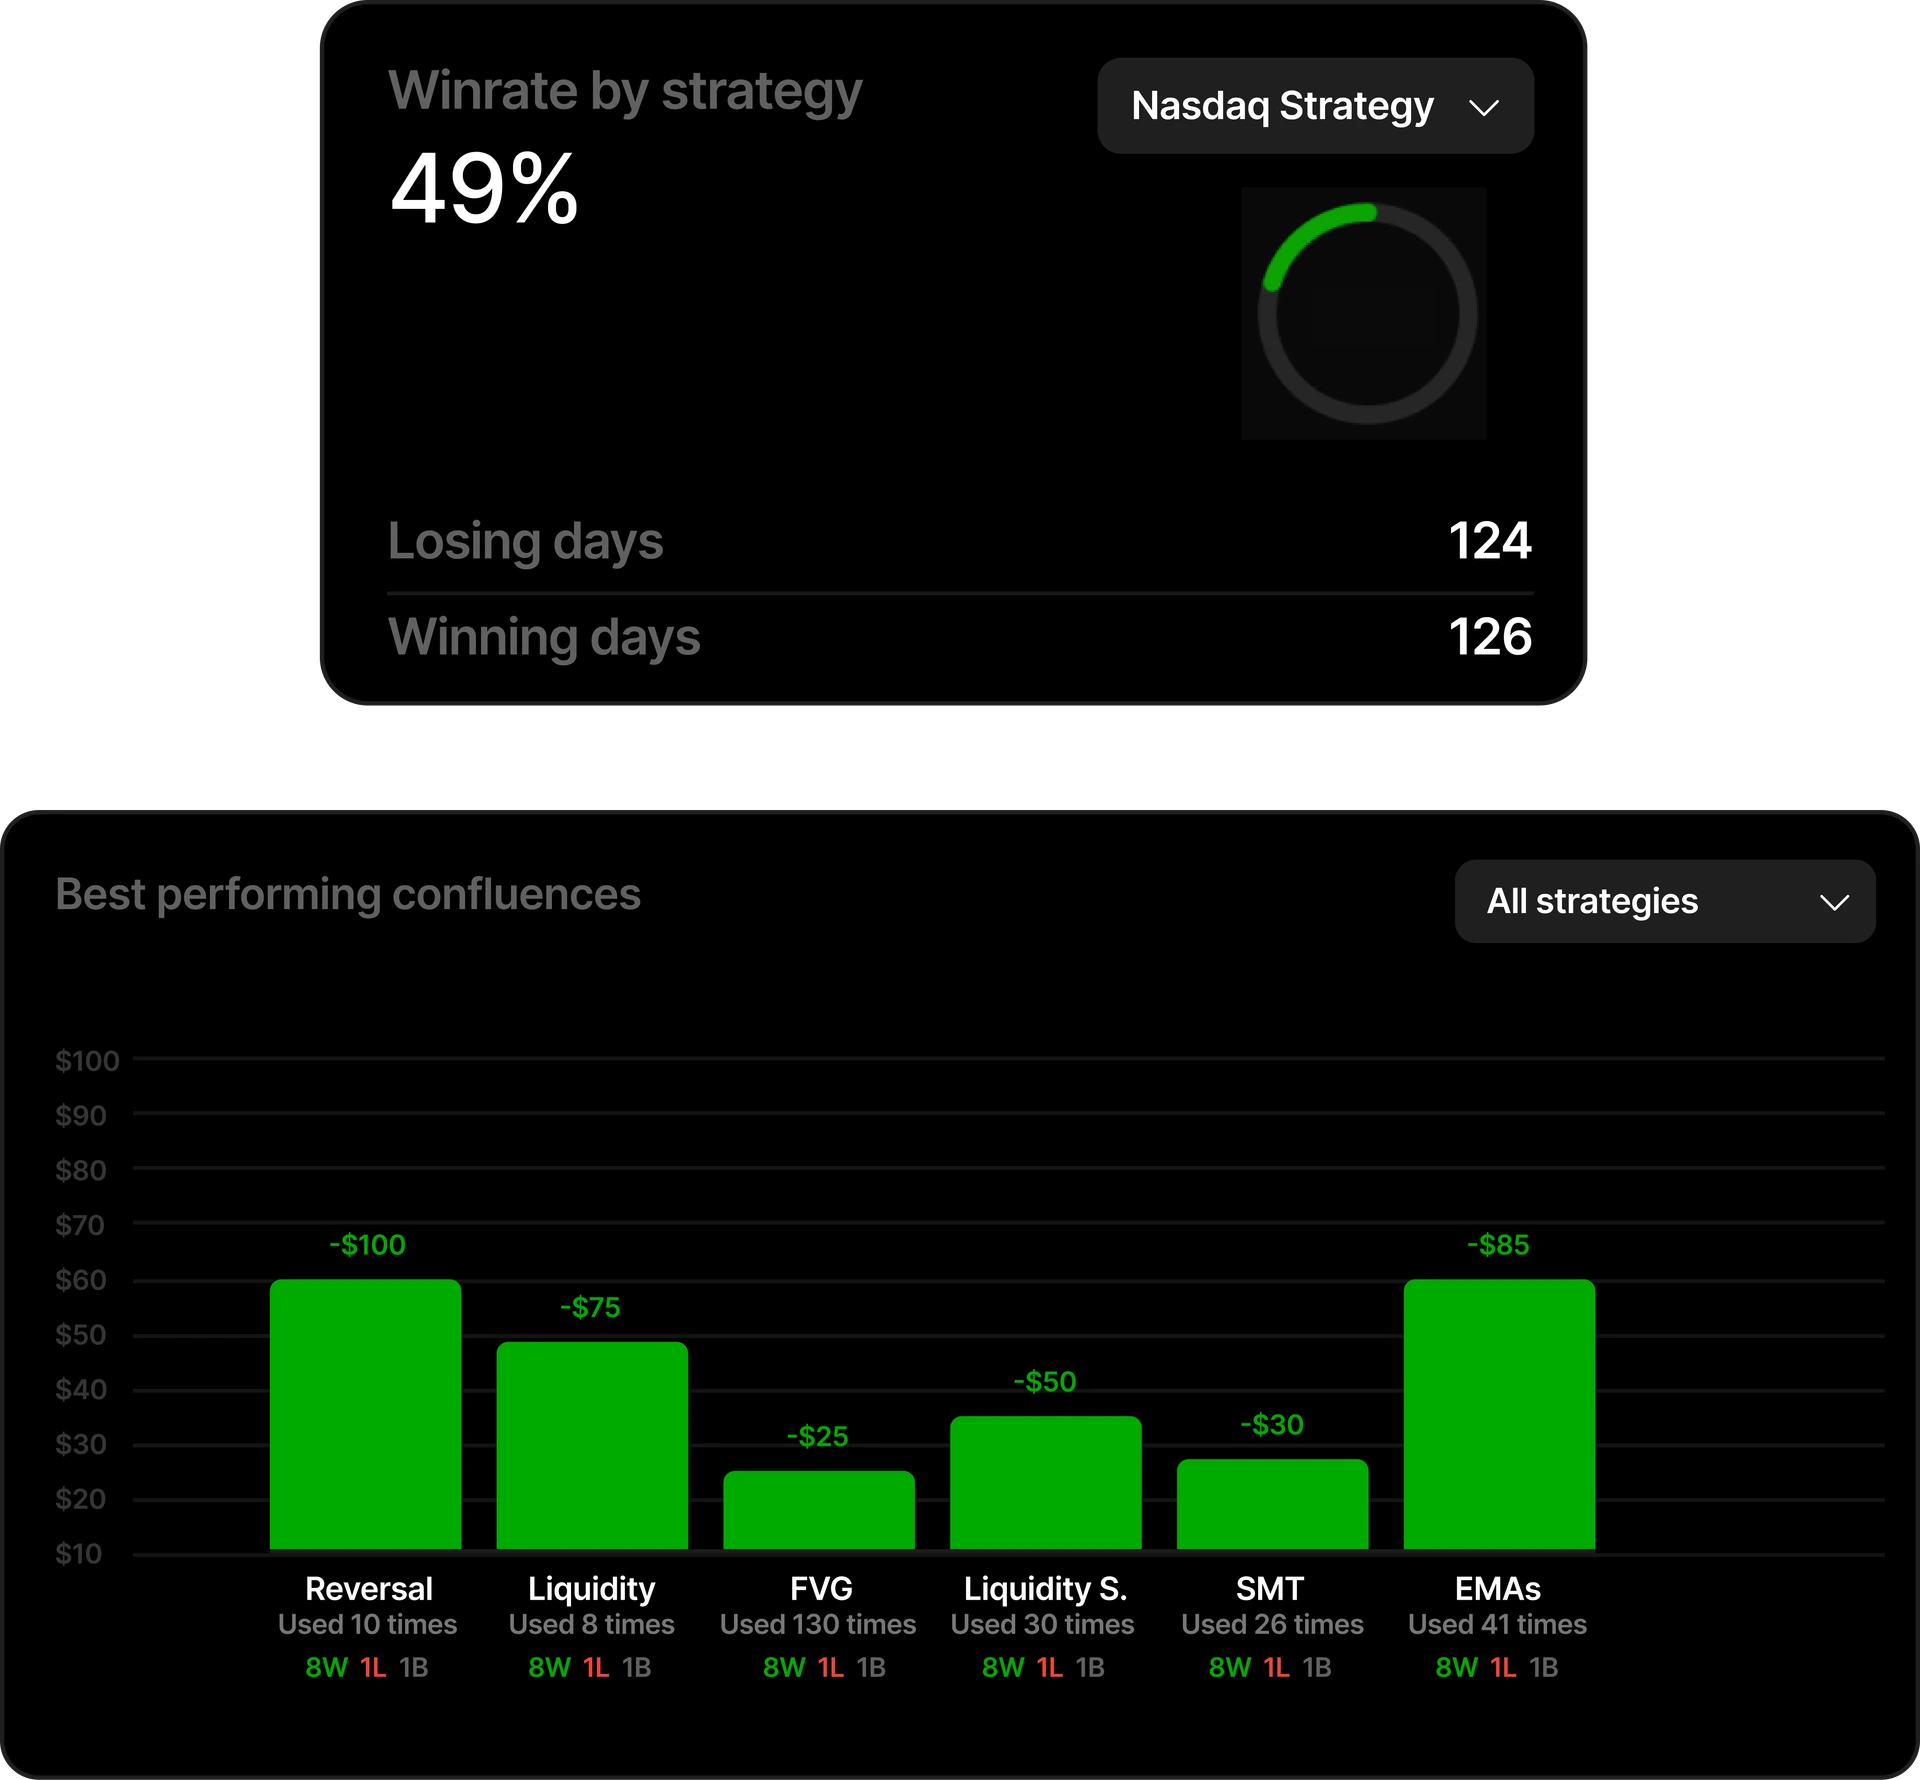
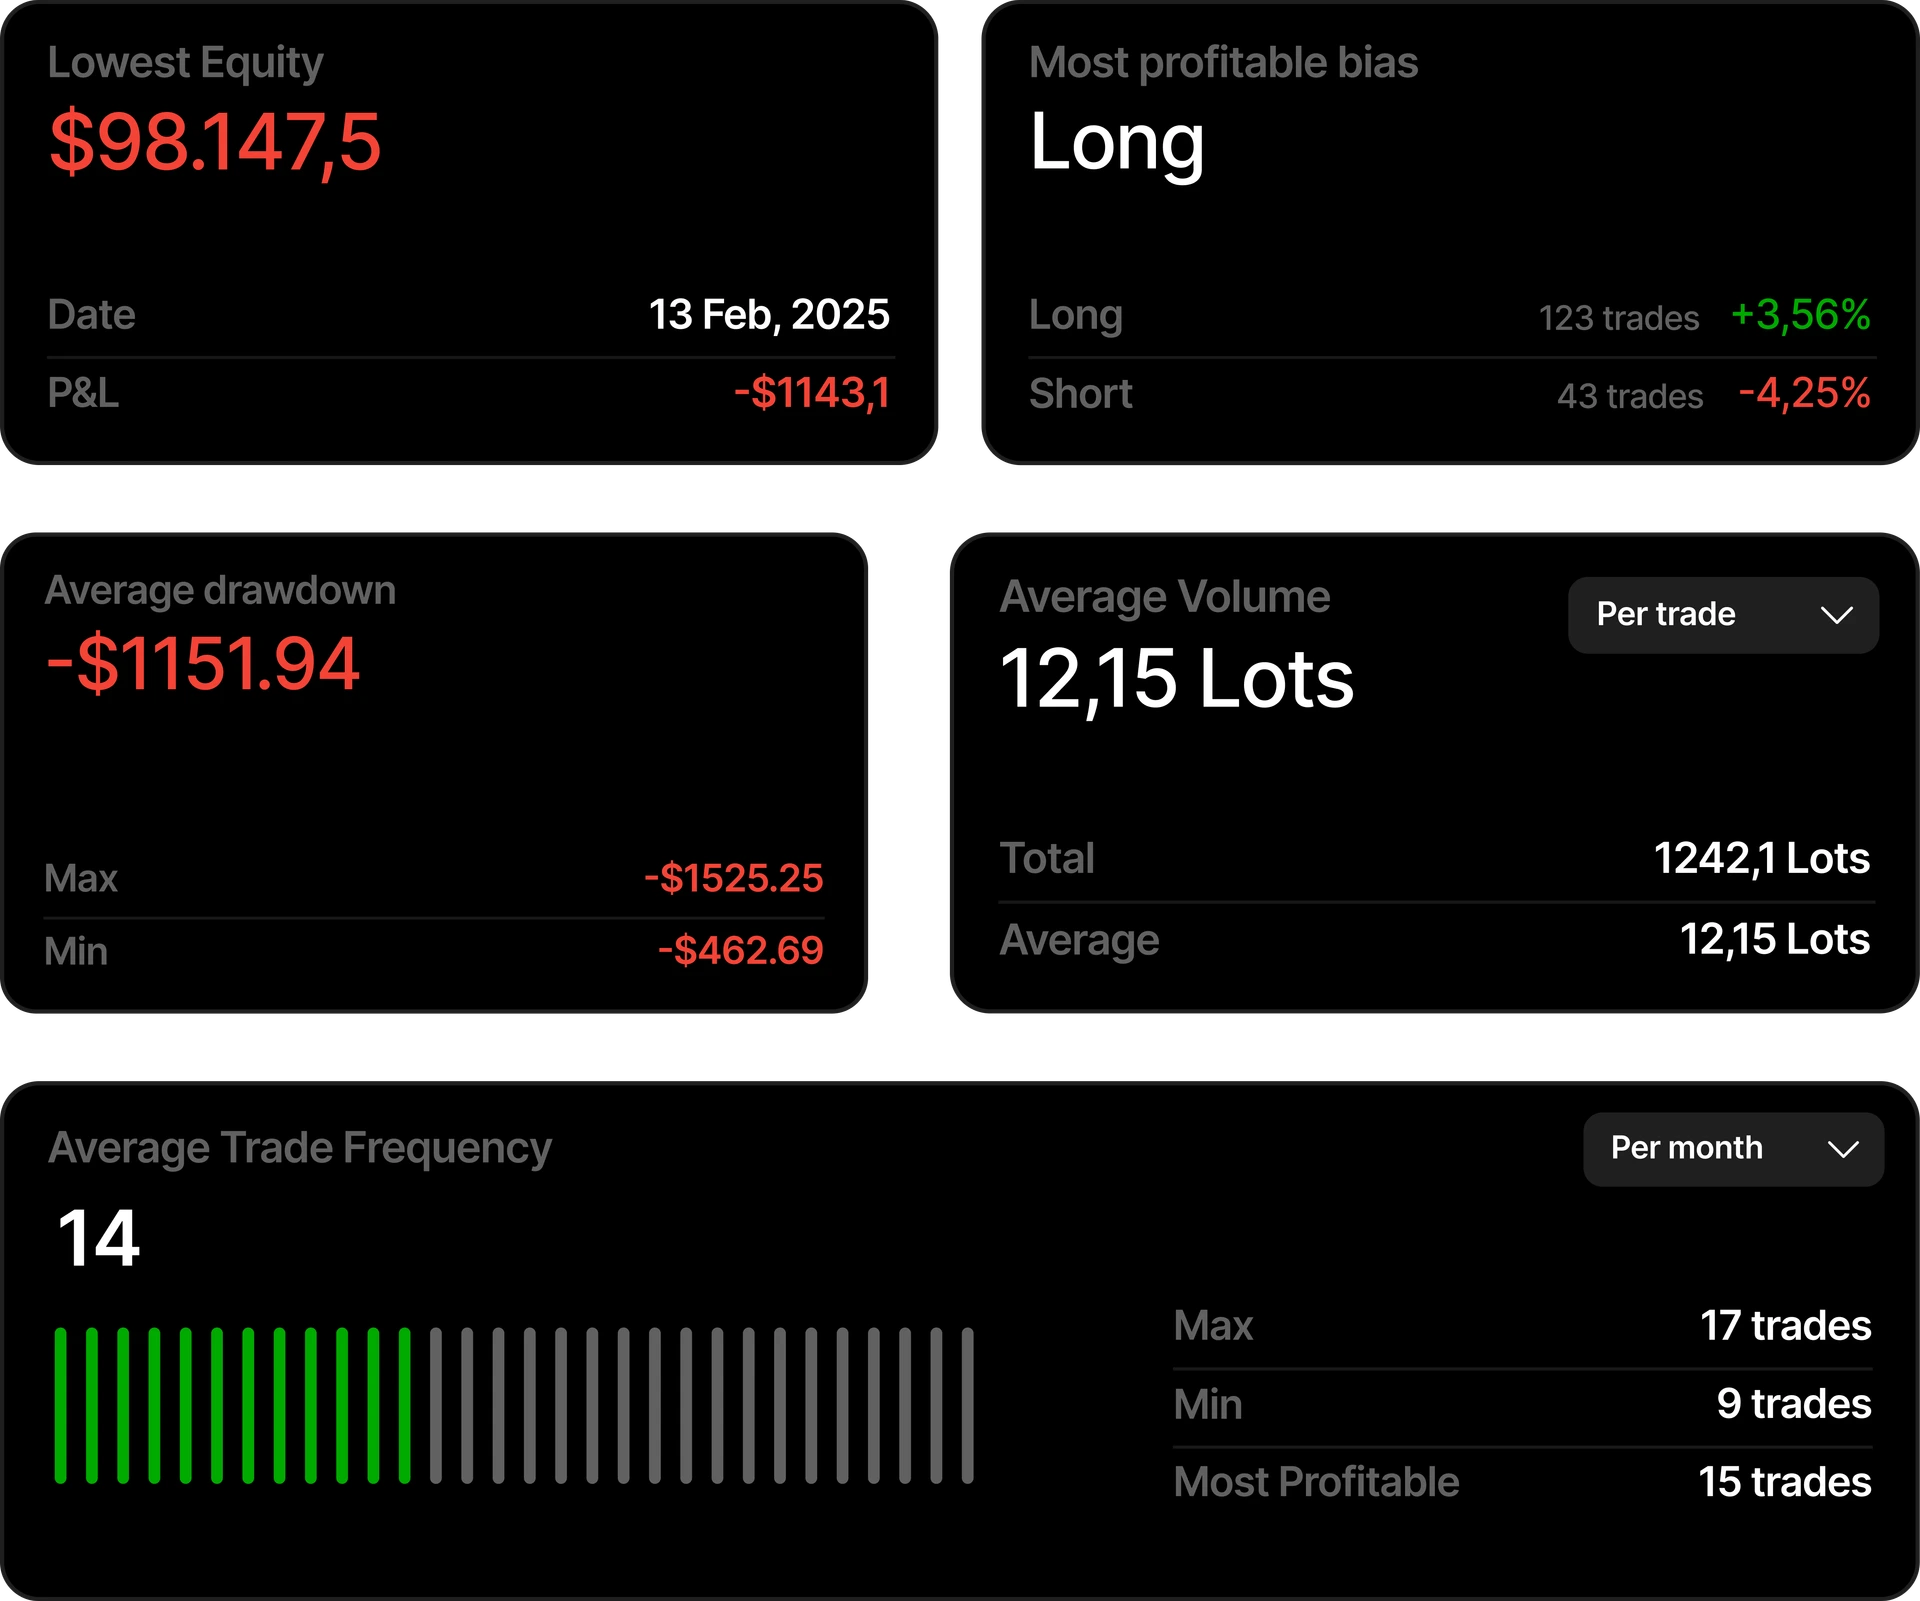
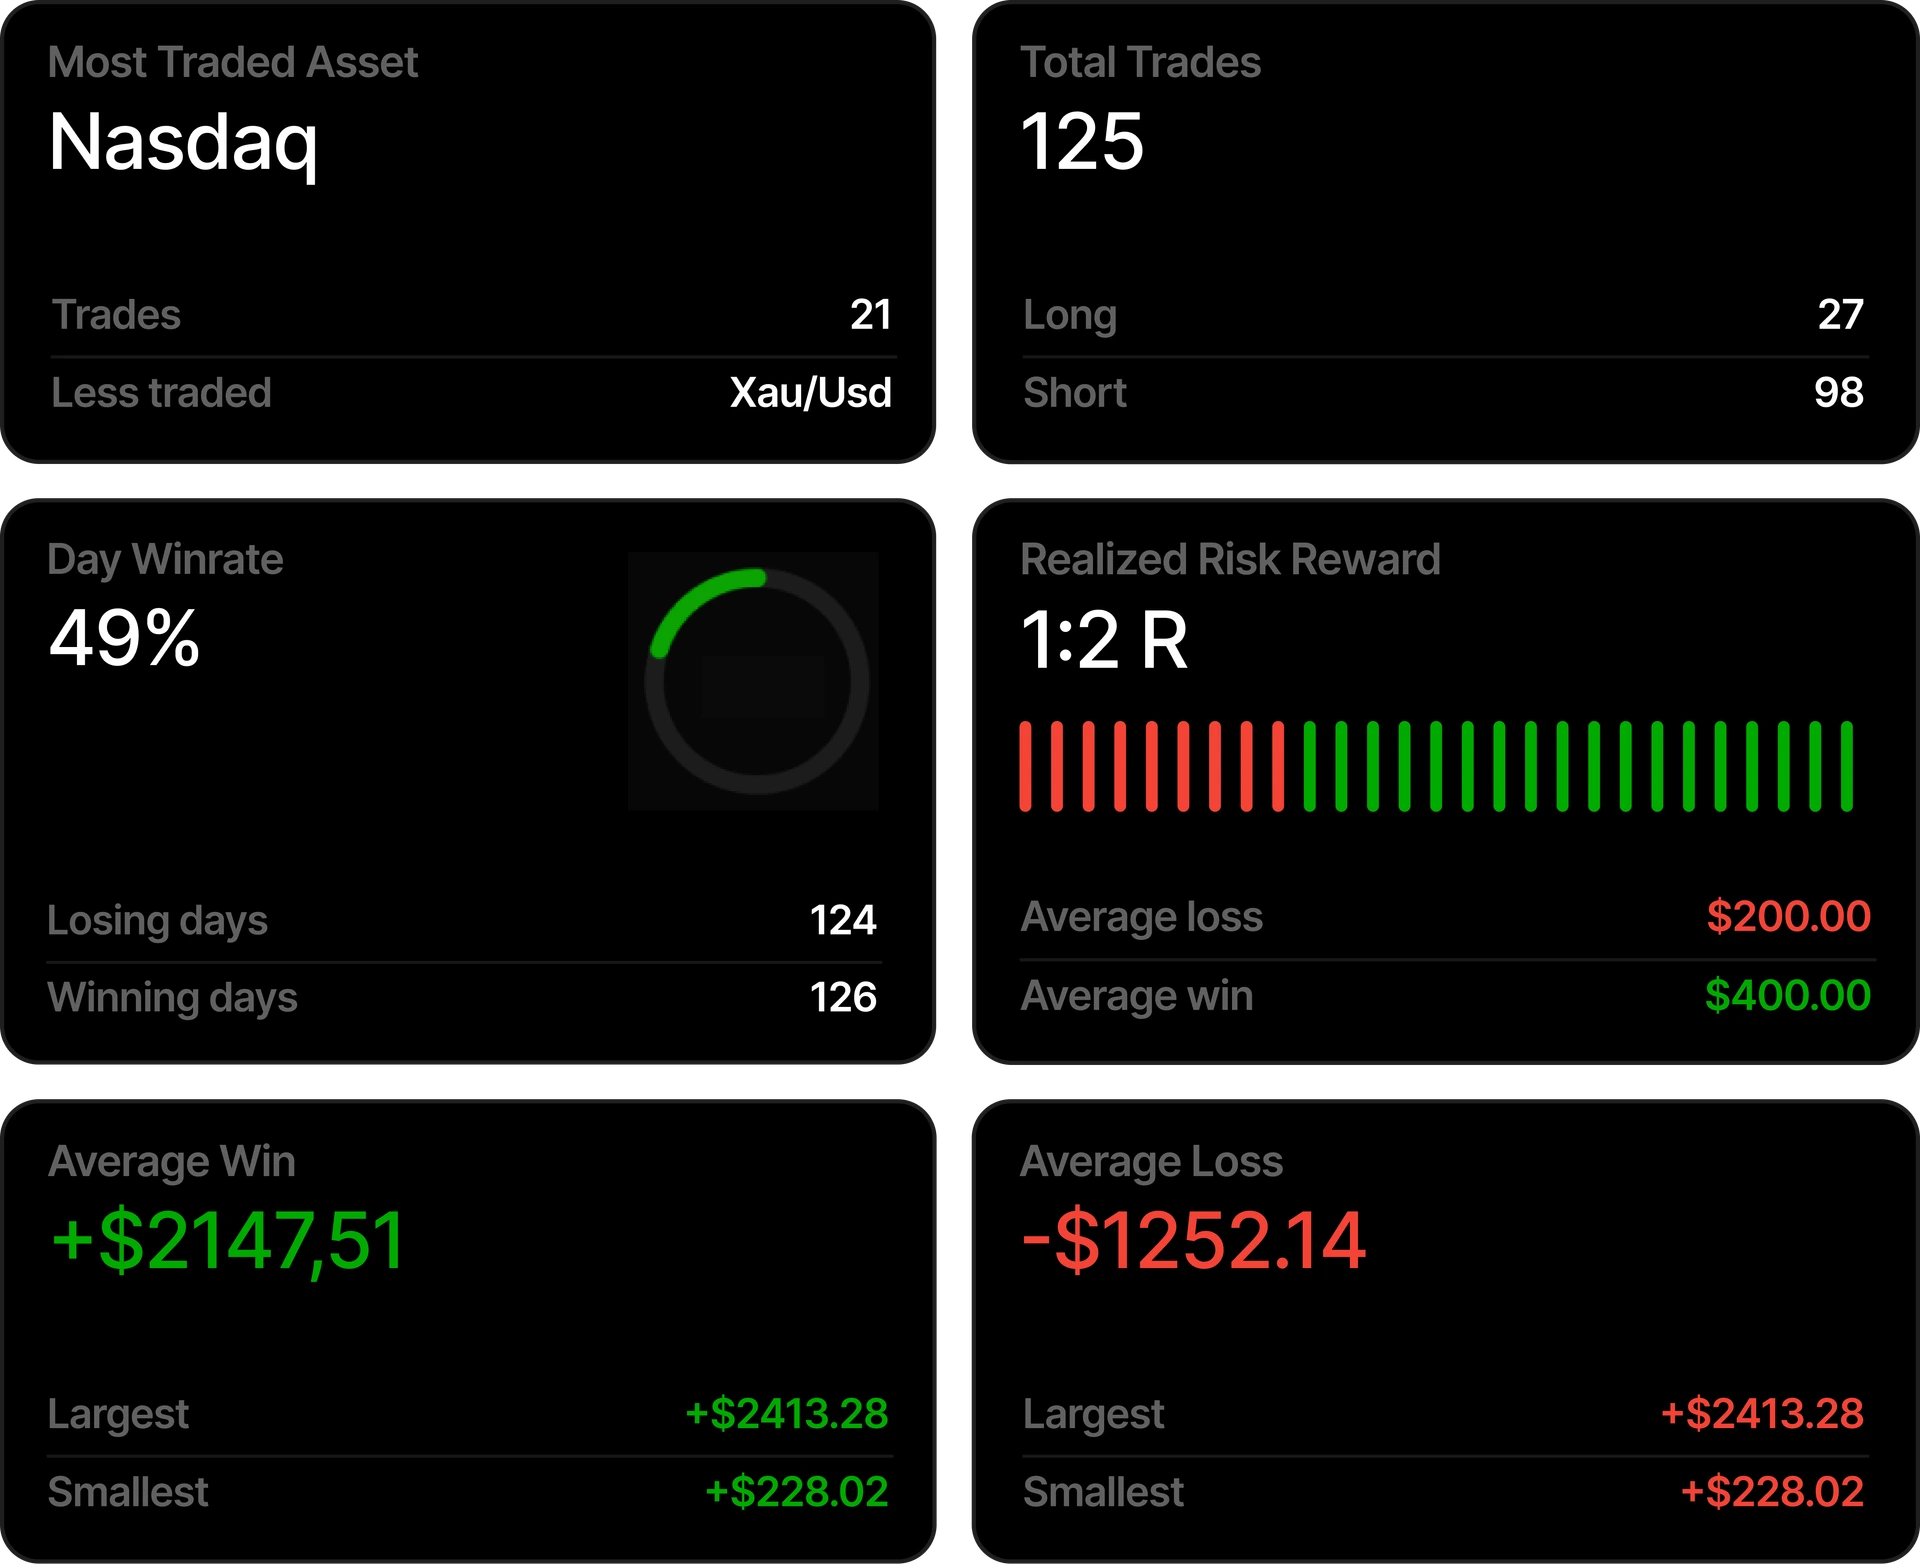
Analyze your backtesting results.Understand what works and what doesn't
Start for free
Visualize your backtesting session performance month by month
The most visual way to analyze your backtesting results, yearly view, monthly, daily and candle by candle with our TradingView chart widget journal.
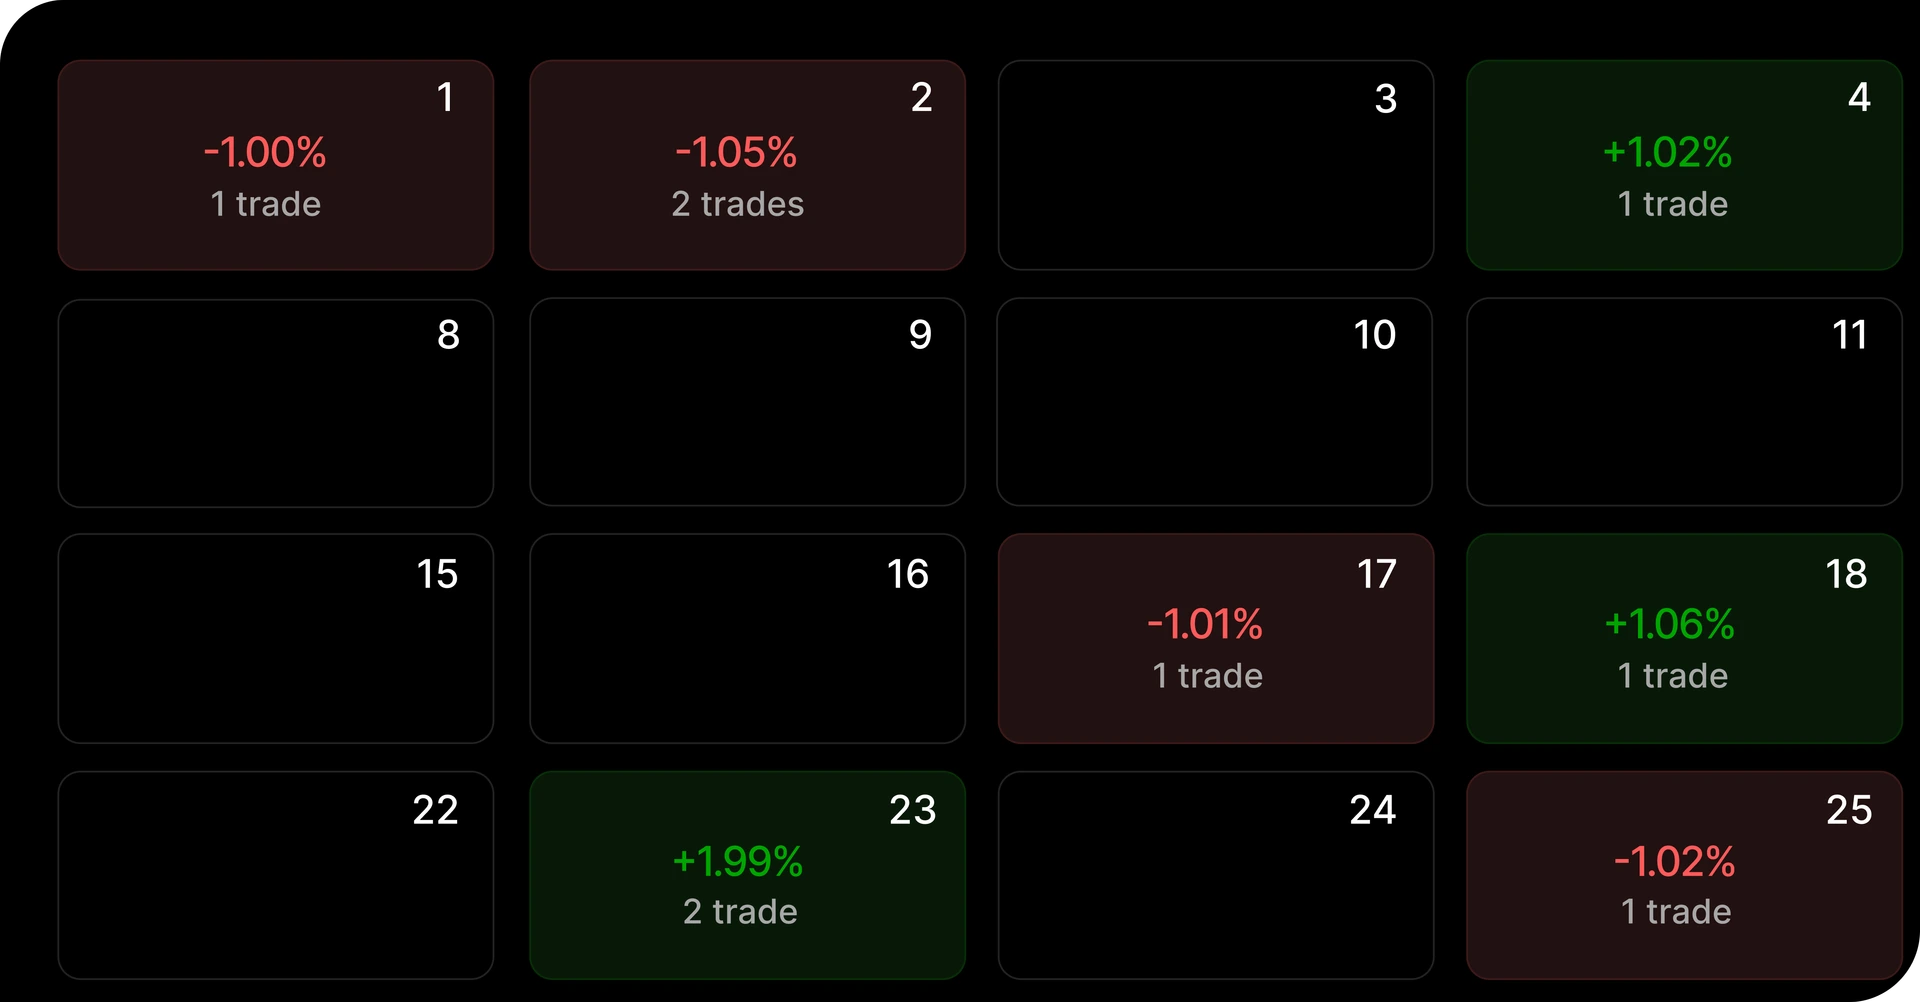
P&L Calendar to view your monthly return
The backtesting trades automatically get logged in your session calendar after closing it. The most intuitive way to test your strategies.
View moreYears of data turned into filtered analytics.Add years of experience to your strategy.
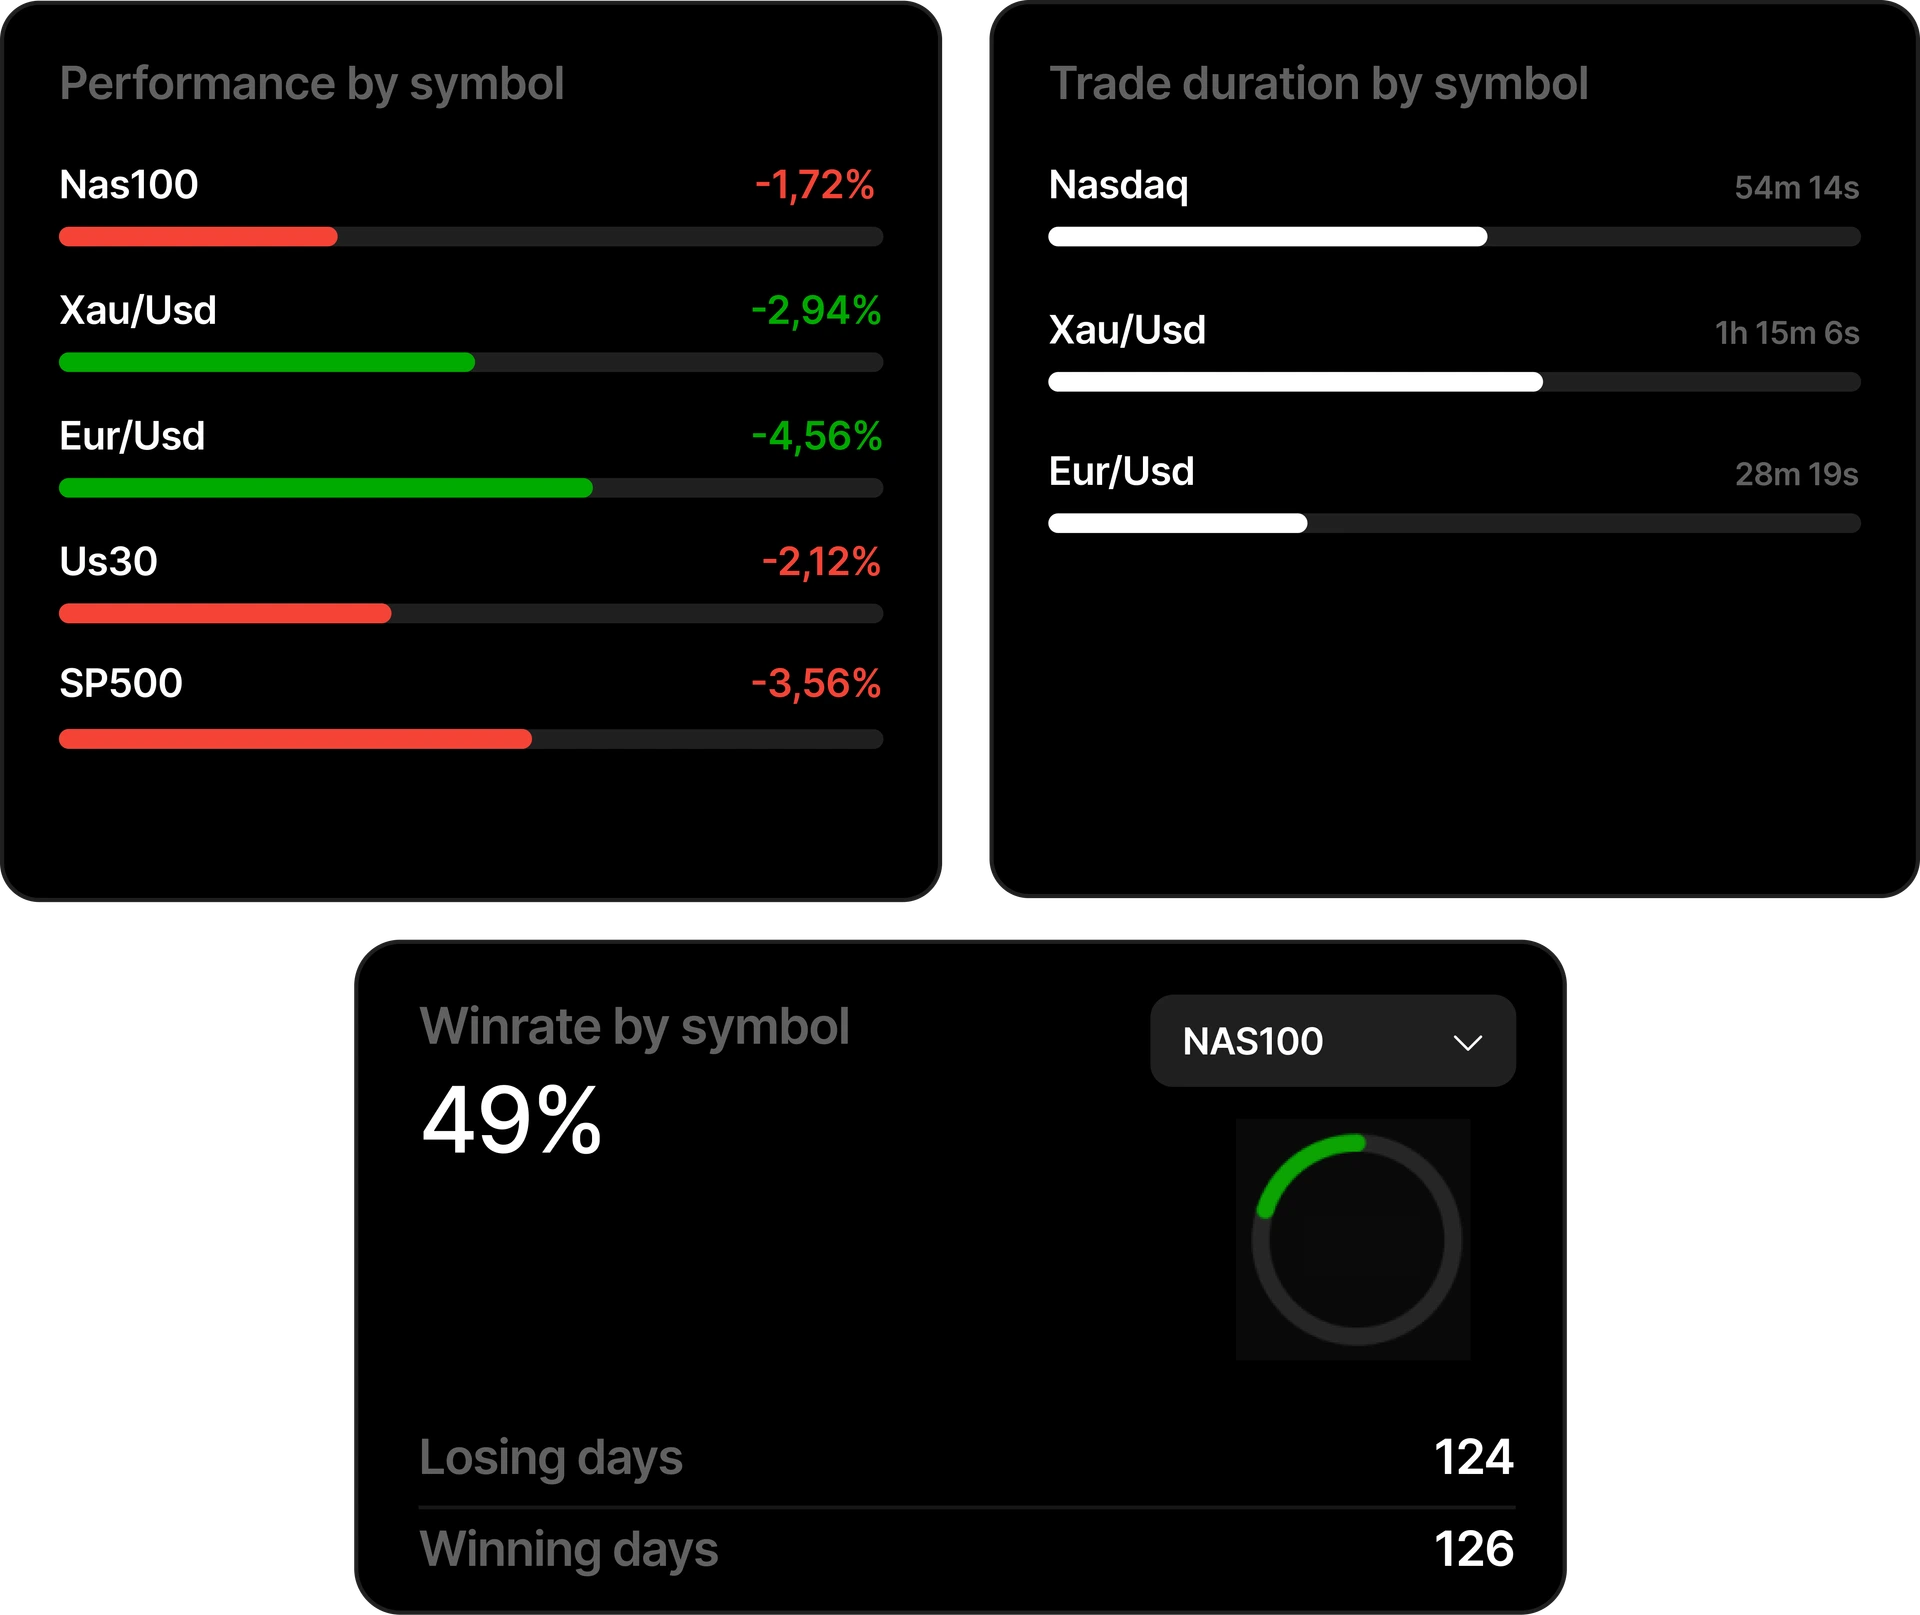
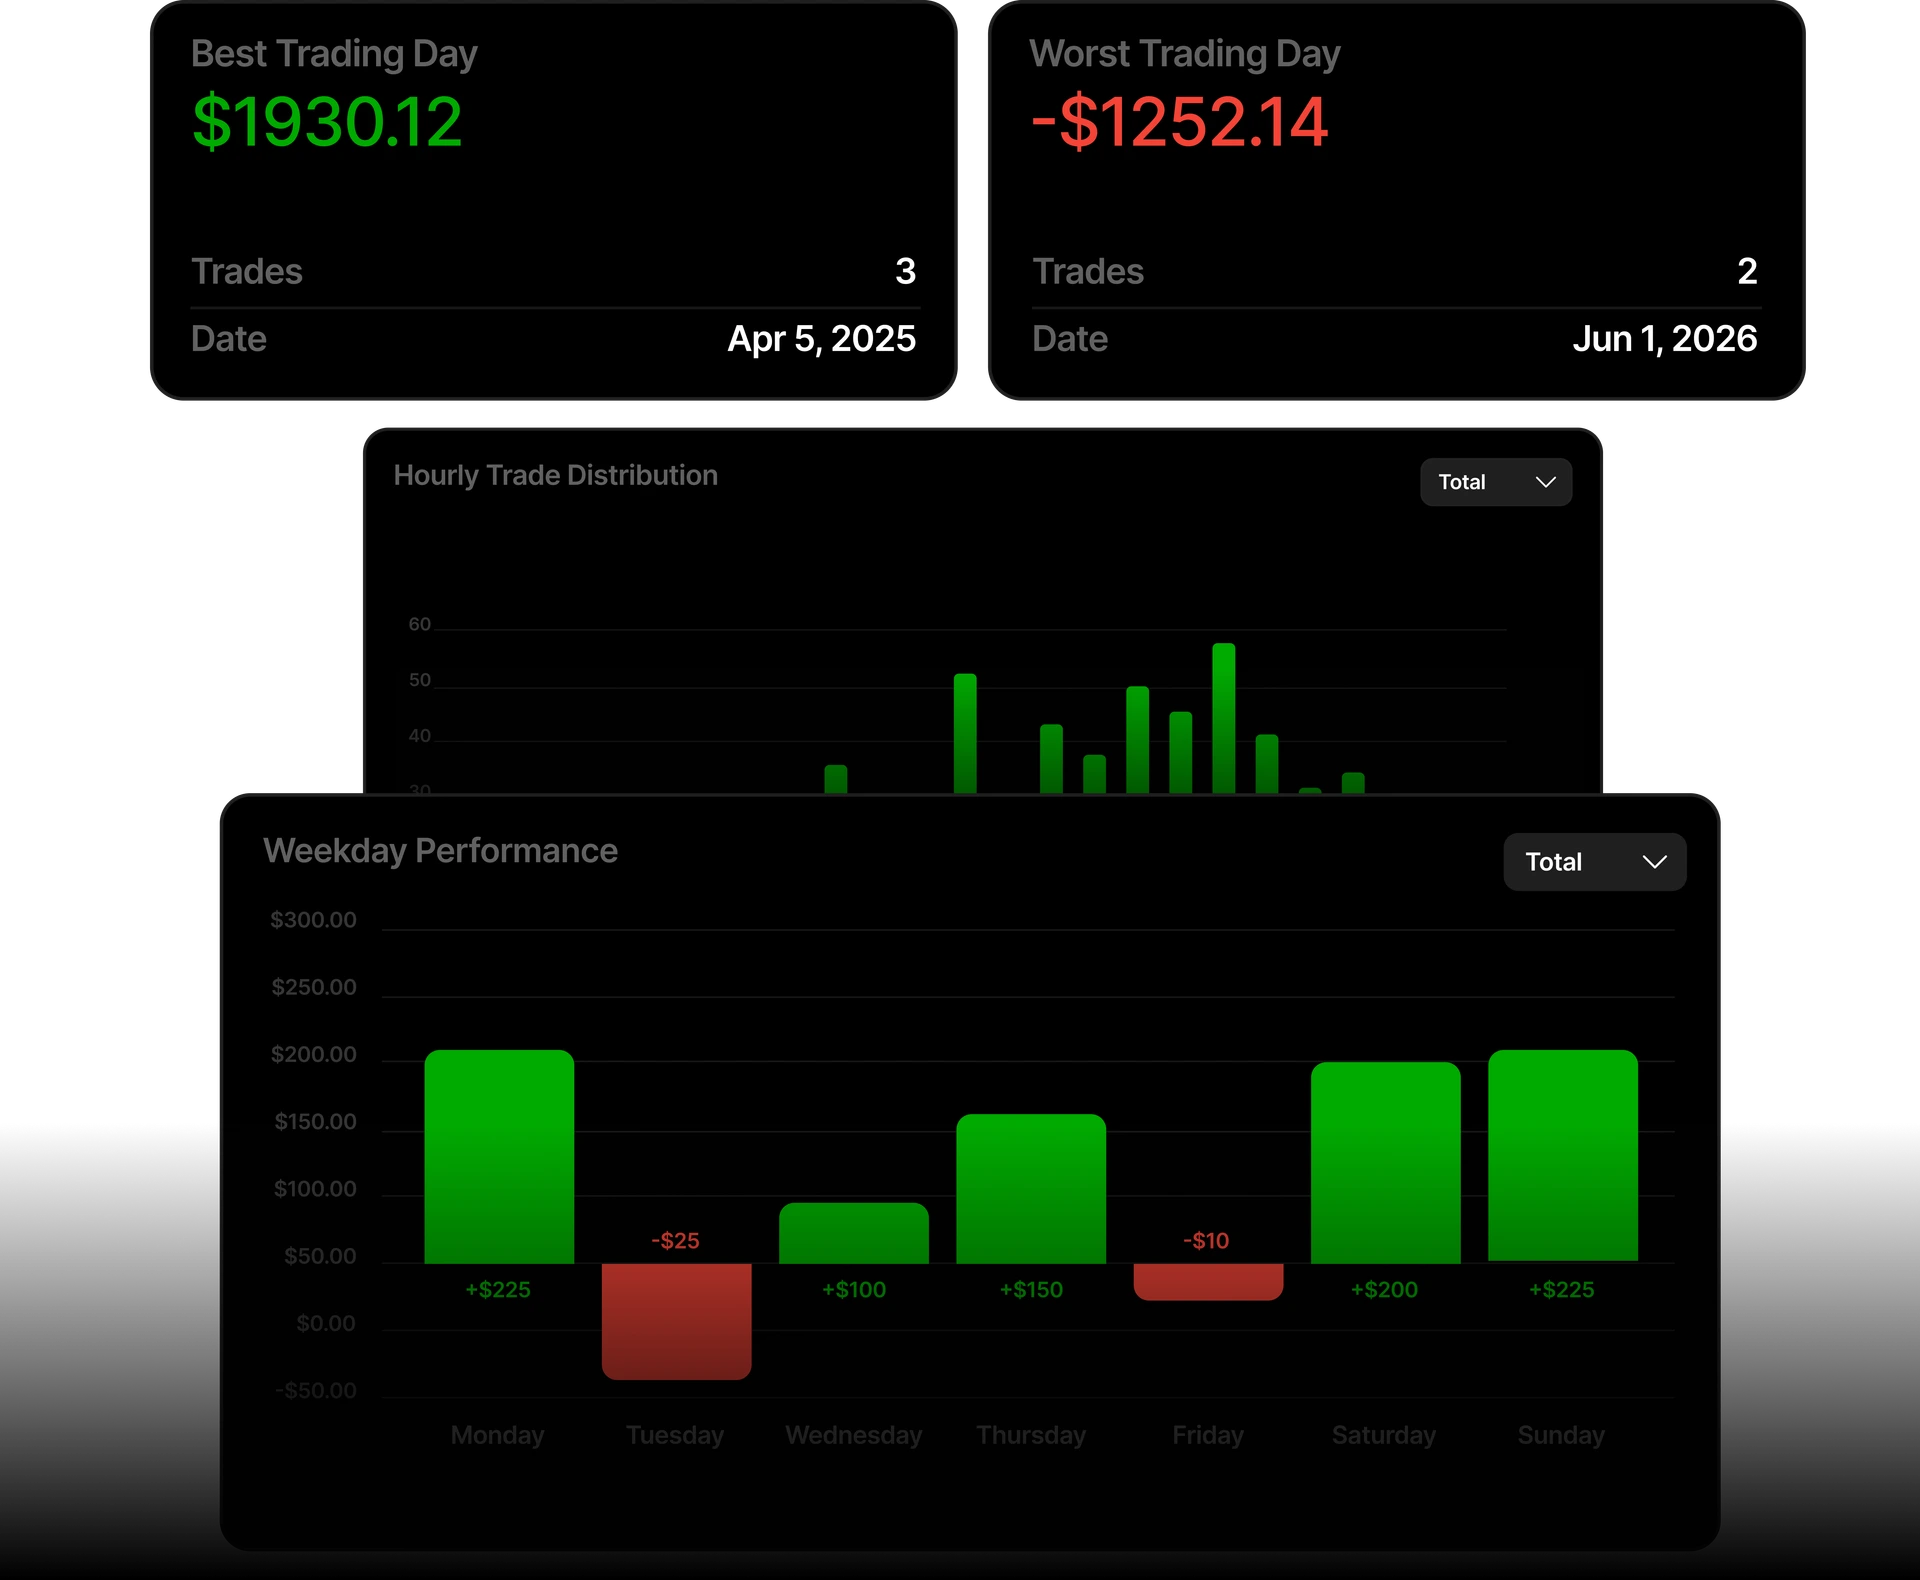
Journal your backtesting trades.Review your mistakes to refine your edge.
Start for freeIn-chart journaling workflow
Journal your trades without leaving the chart, then review them when the backtesting session is finished
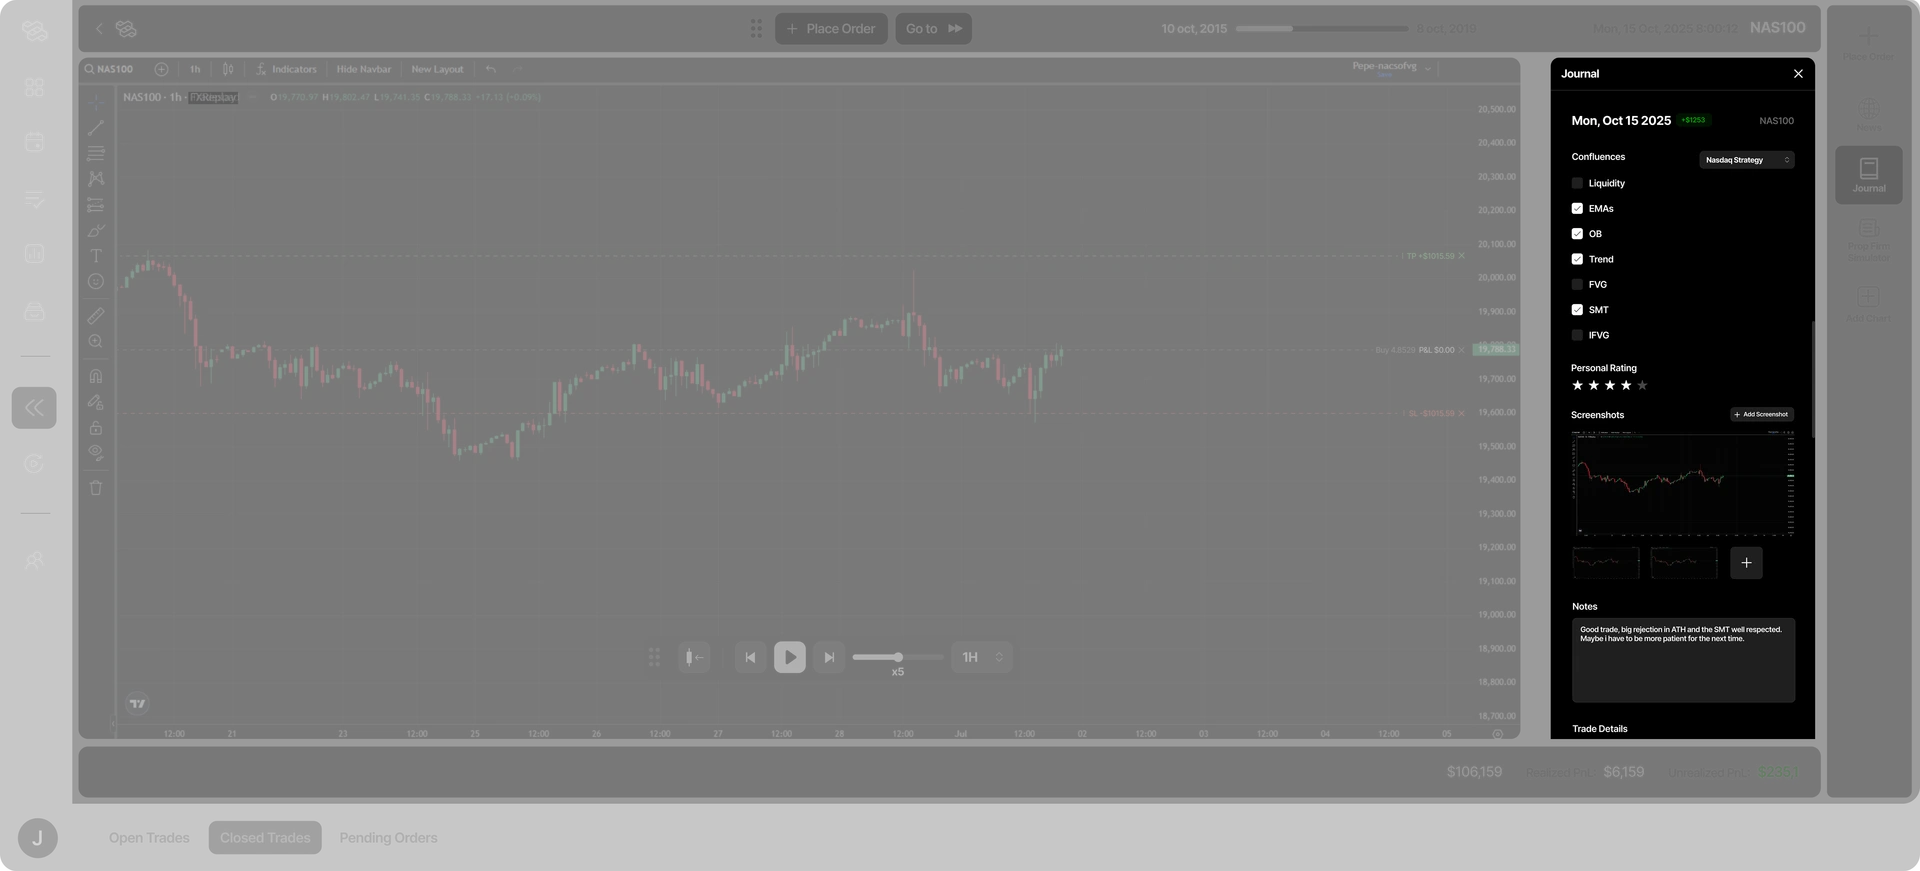
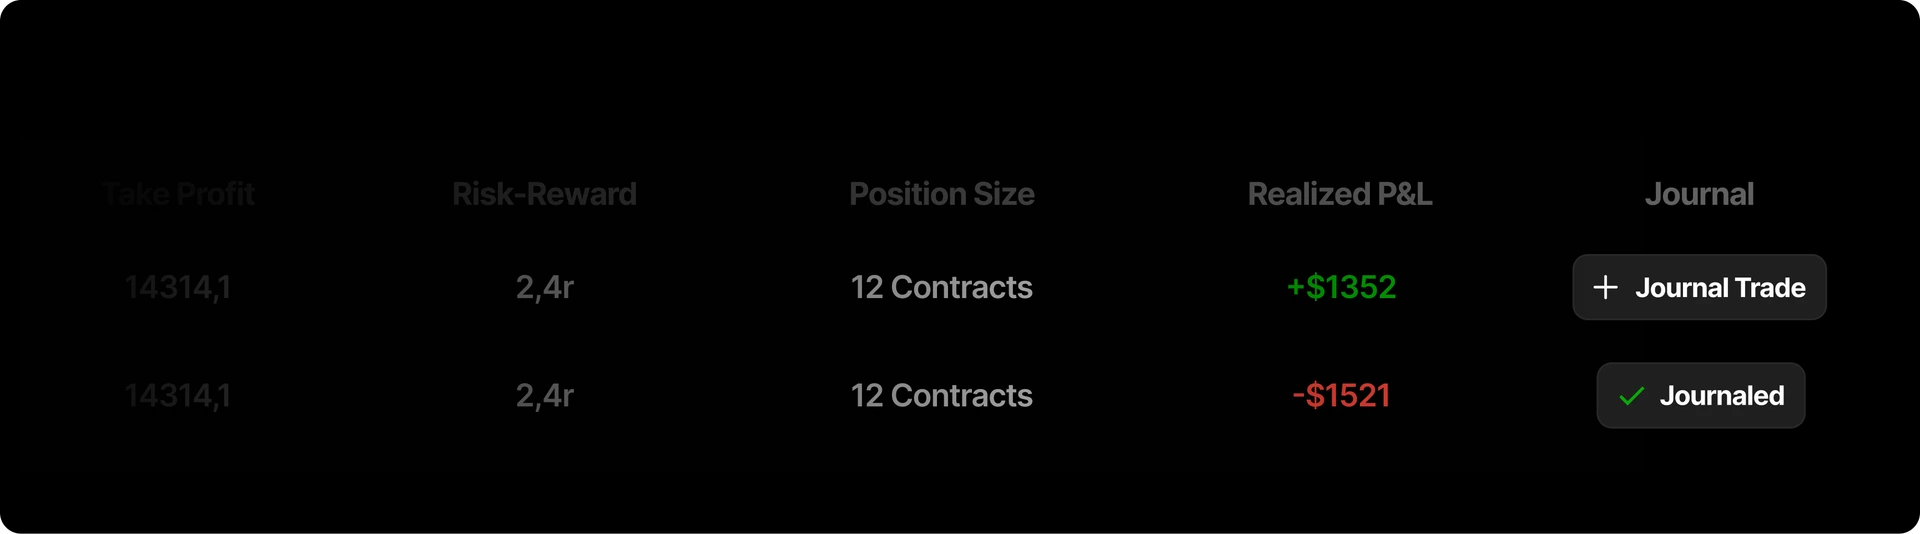
The most intuitive way to journal your backtesting trades
Journal when the trade is opened or after closing it, then review it whenever you want in the backtesting journal.
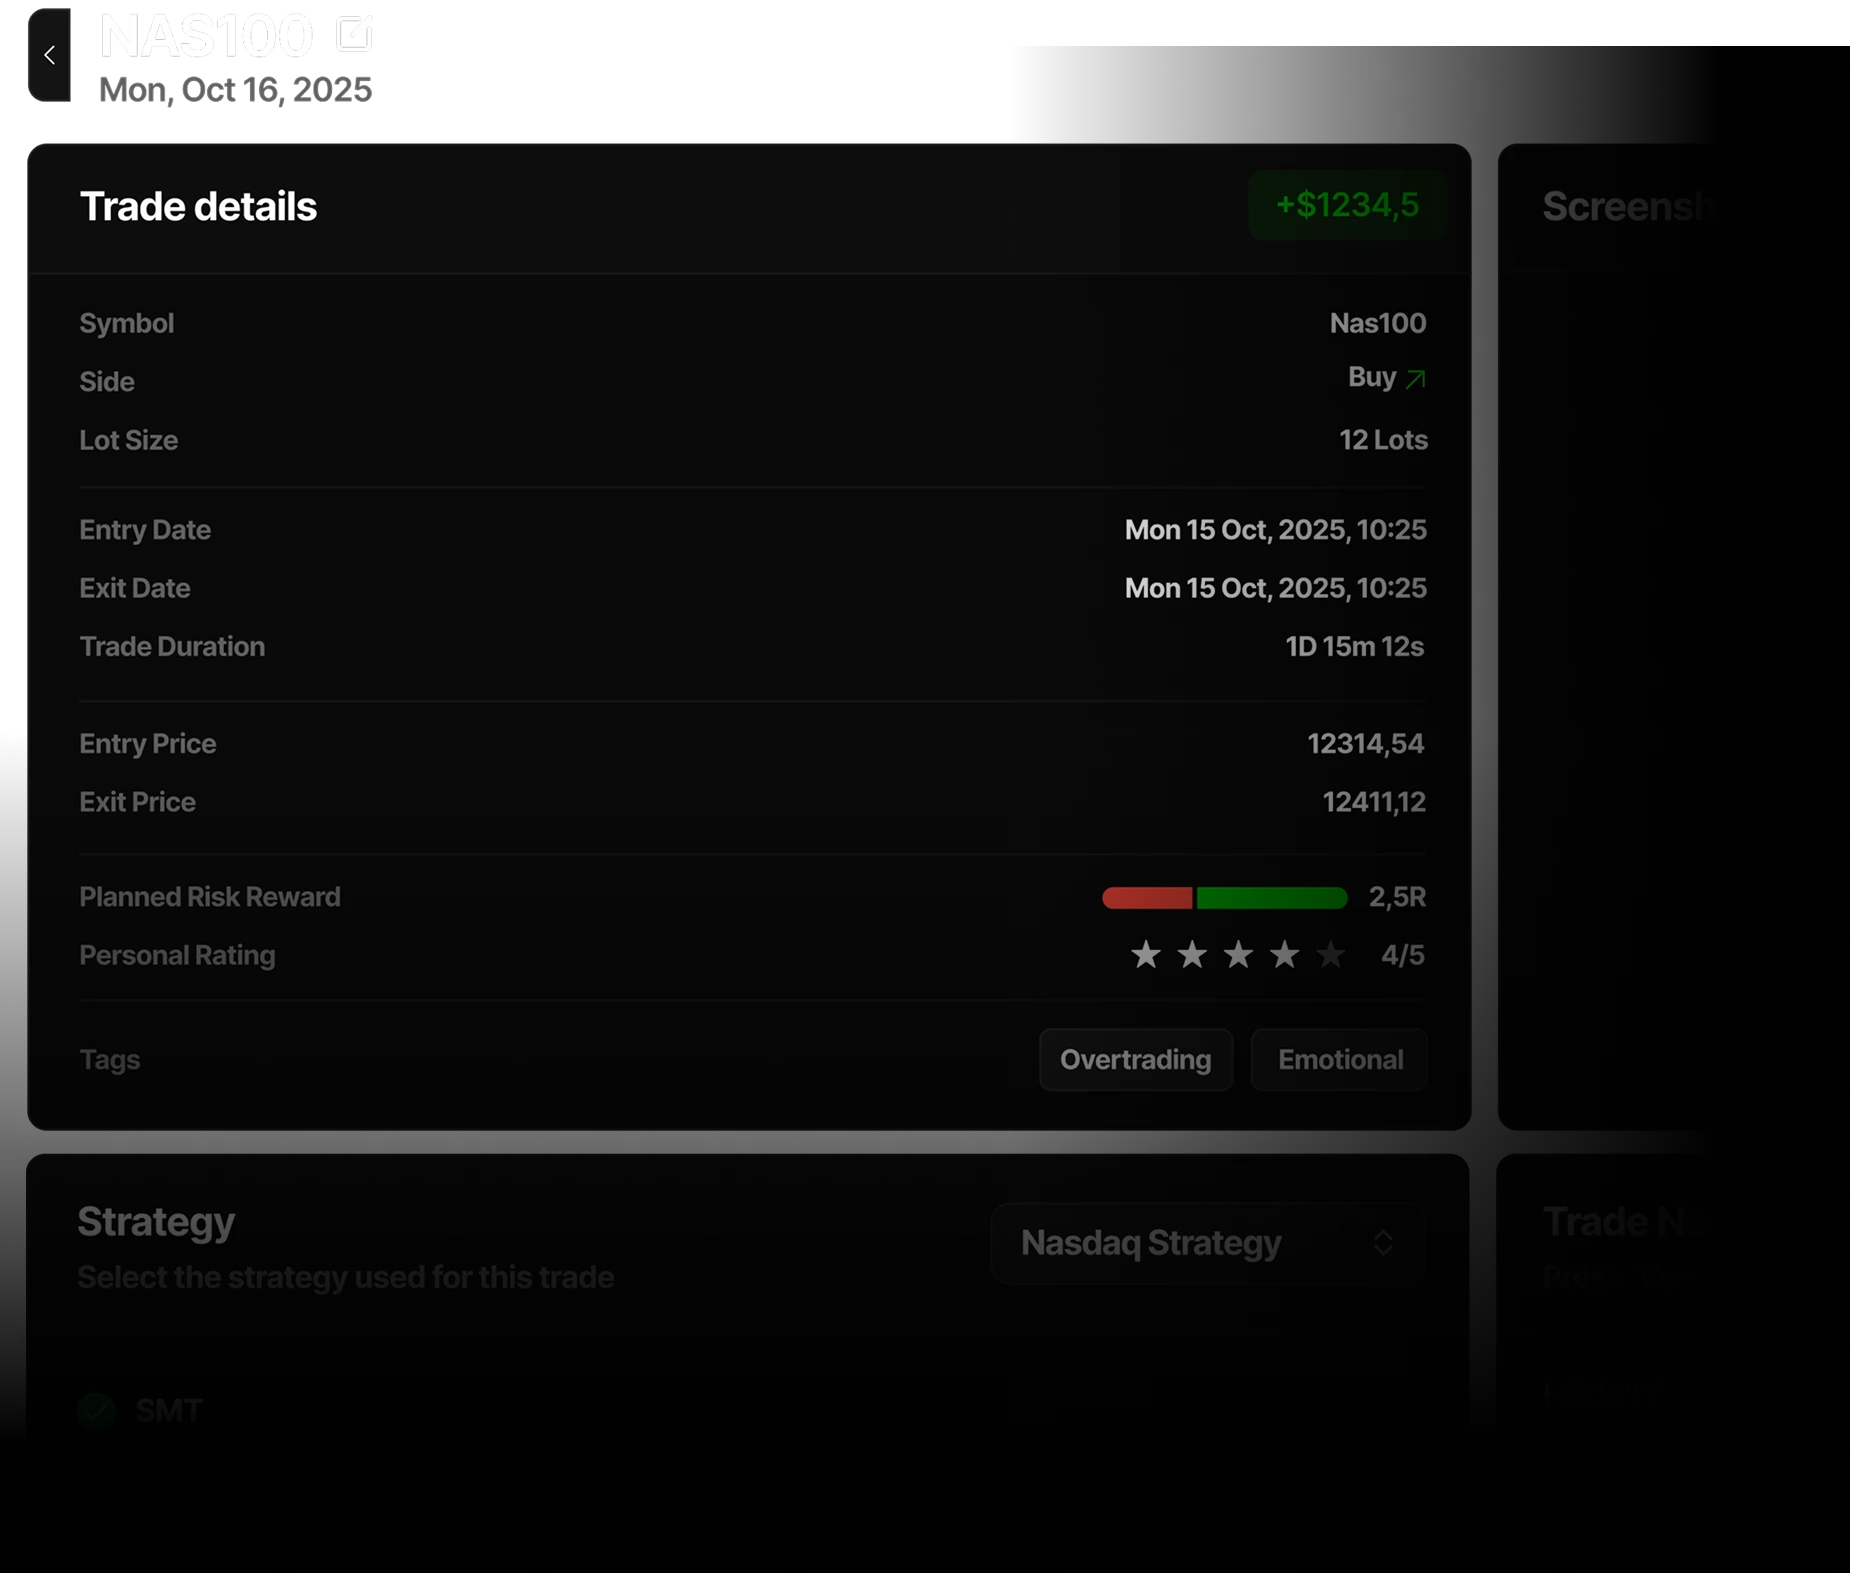
Review your trades post-session
Access the backtesting journal to review your trades
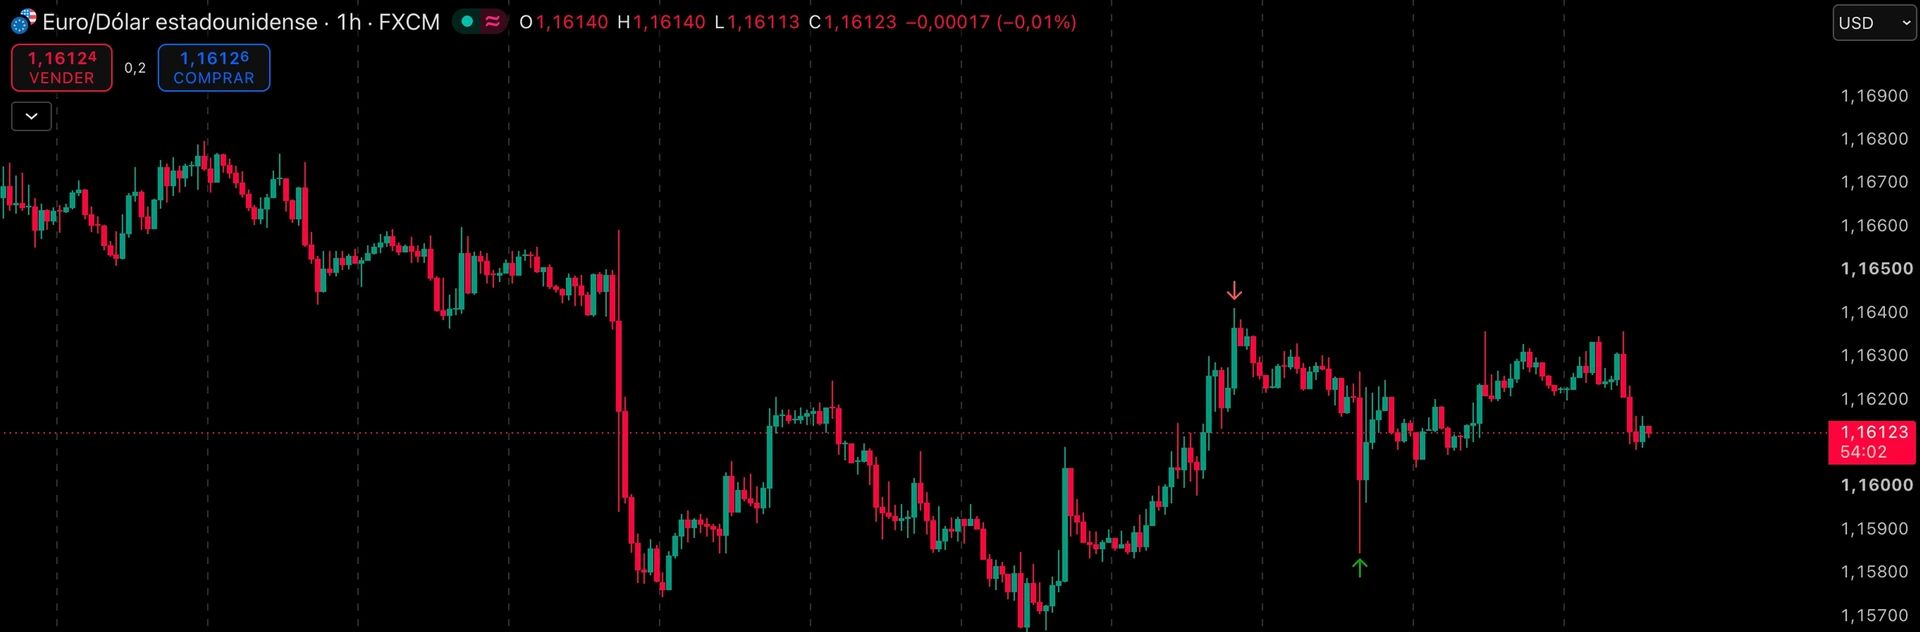
Automatically generated entry and exit point
A visual way to remember your trades. Get automatically the real entry and exit point of your backtesting trades in a TradingView chart.
The most realistic trading simulator.Real market conditions with realistic tools.
Start for free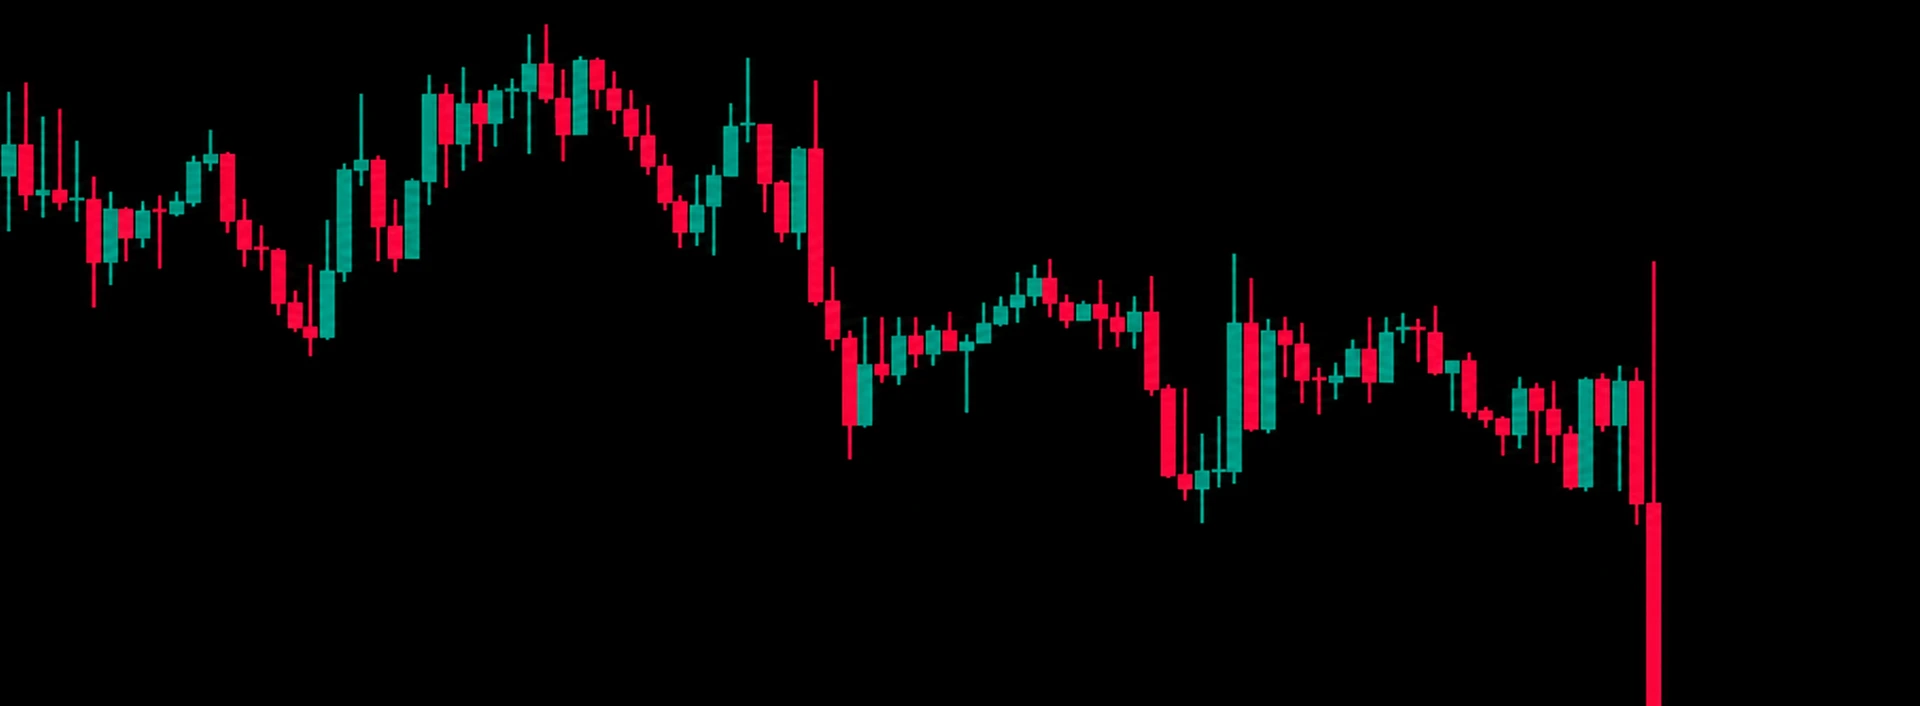
Draggable Stop Loss, Take Profit and Order Limit
The smoother experience to place and manage your backtesting trades, no more numbers and calculations.
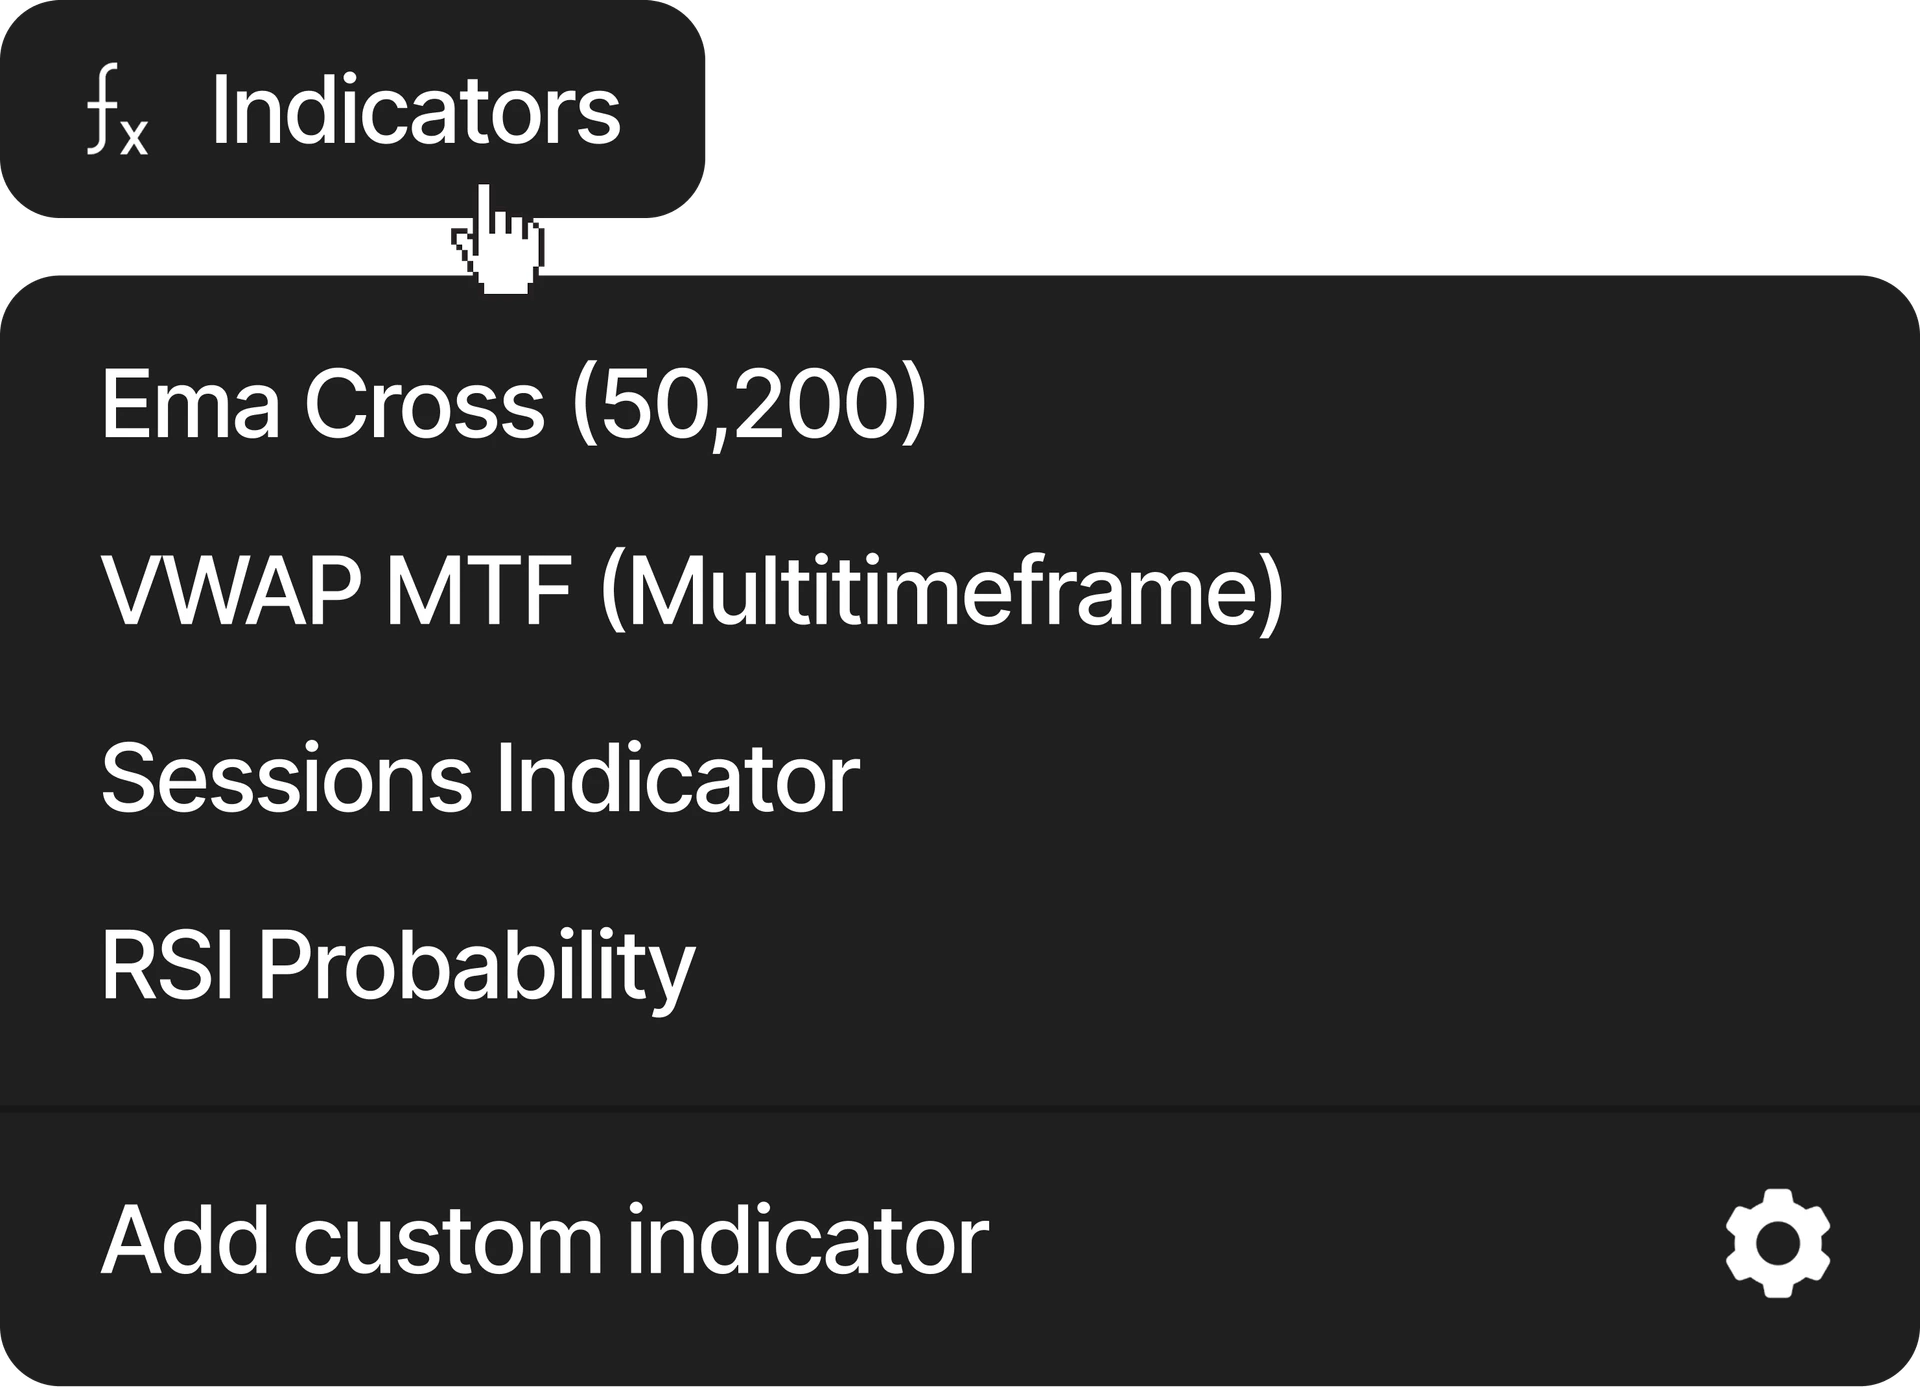
Custom indicators (Soon)
Use the pre-created indicators or create your own custom one
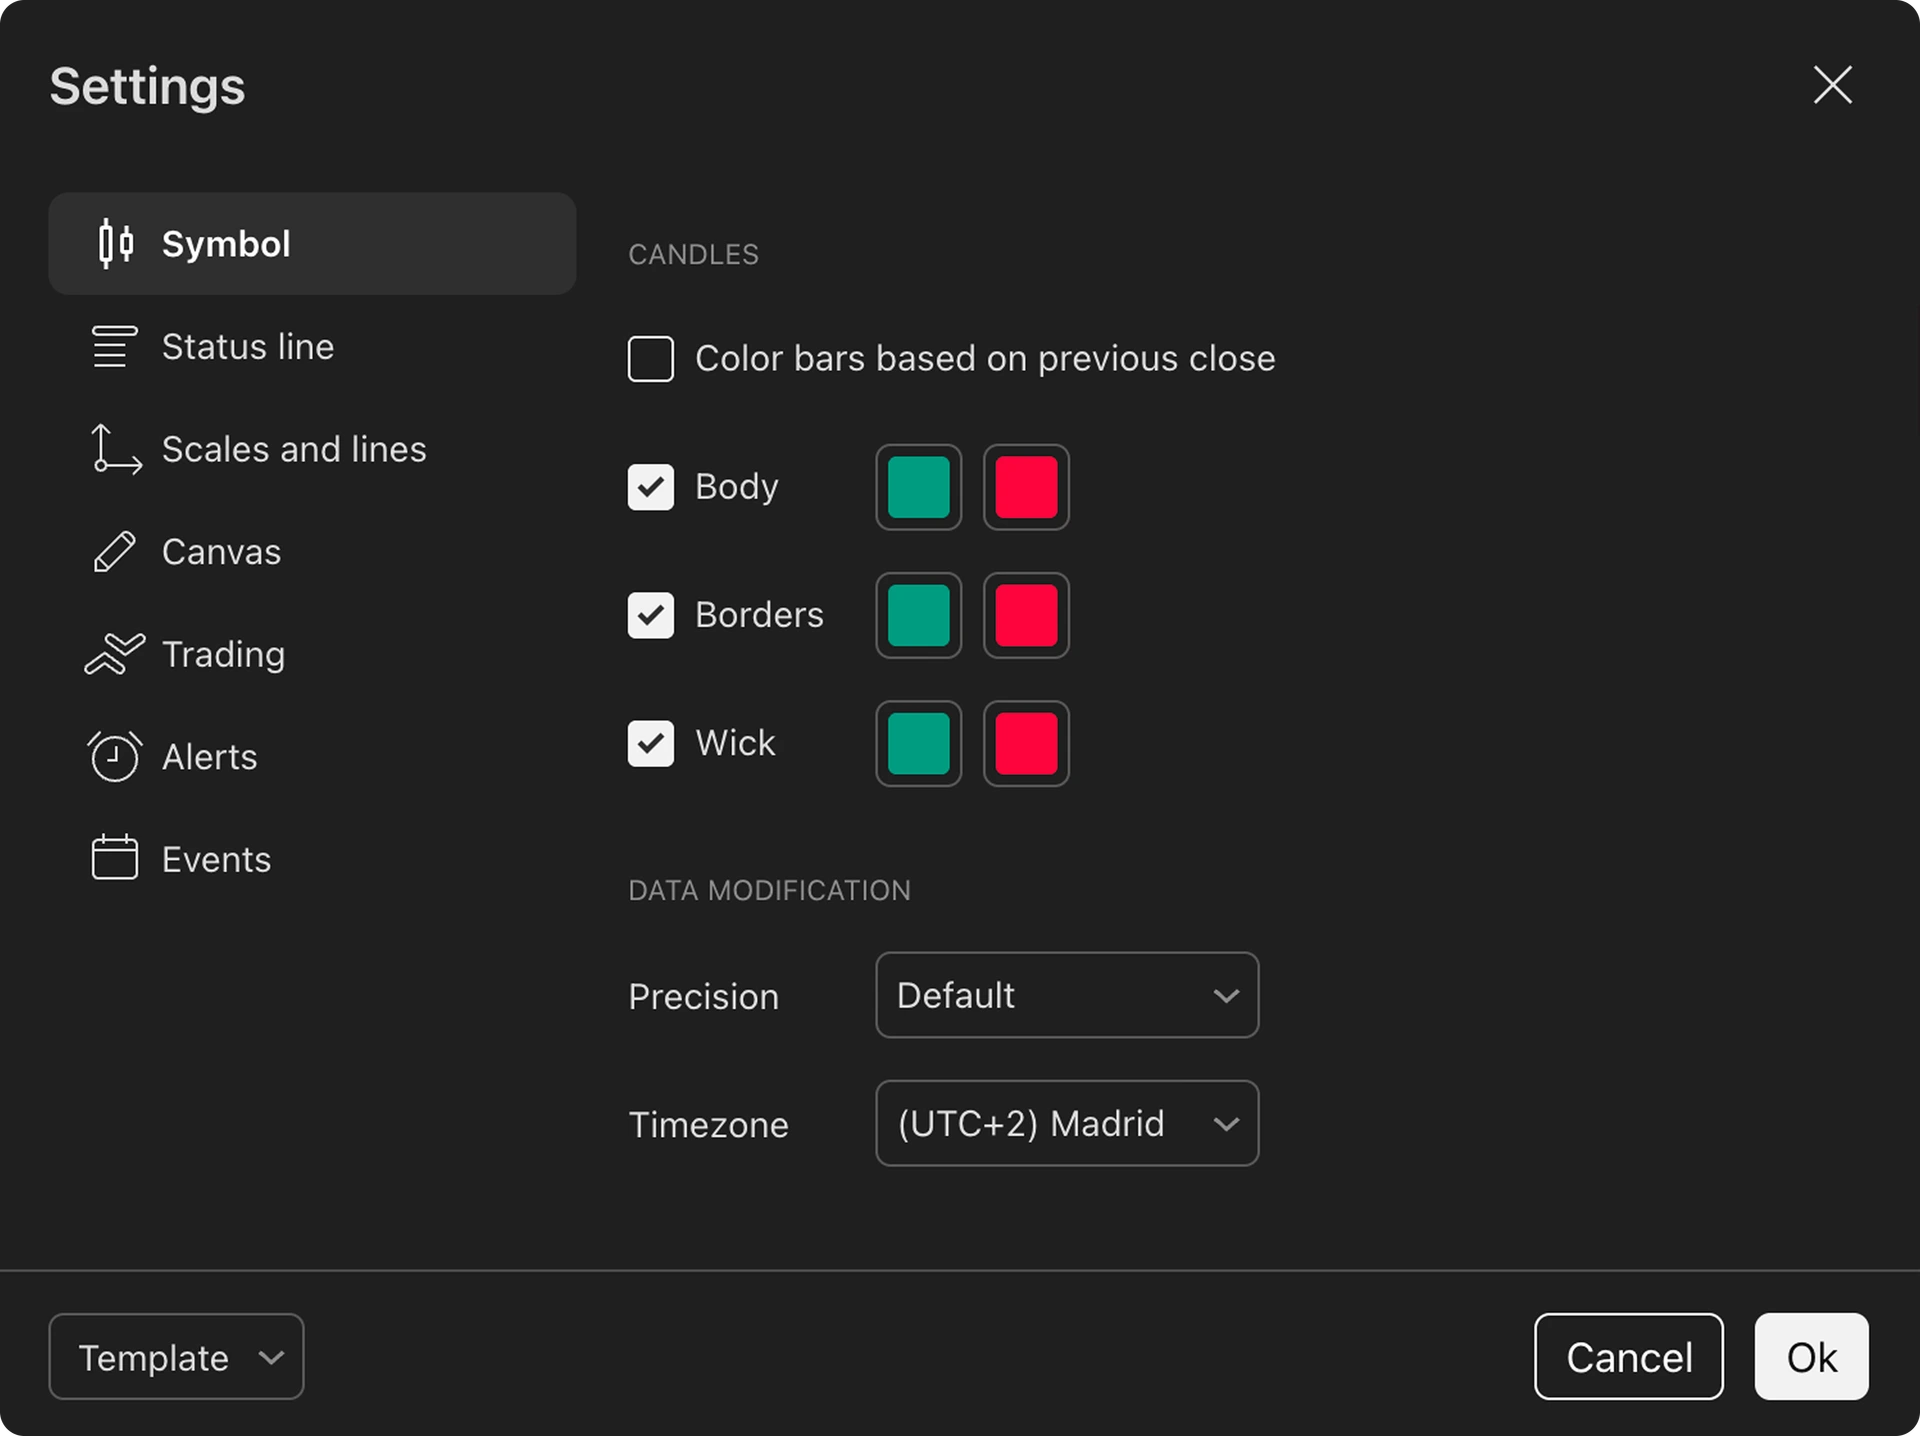
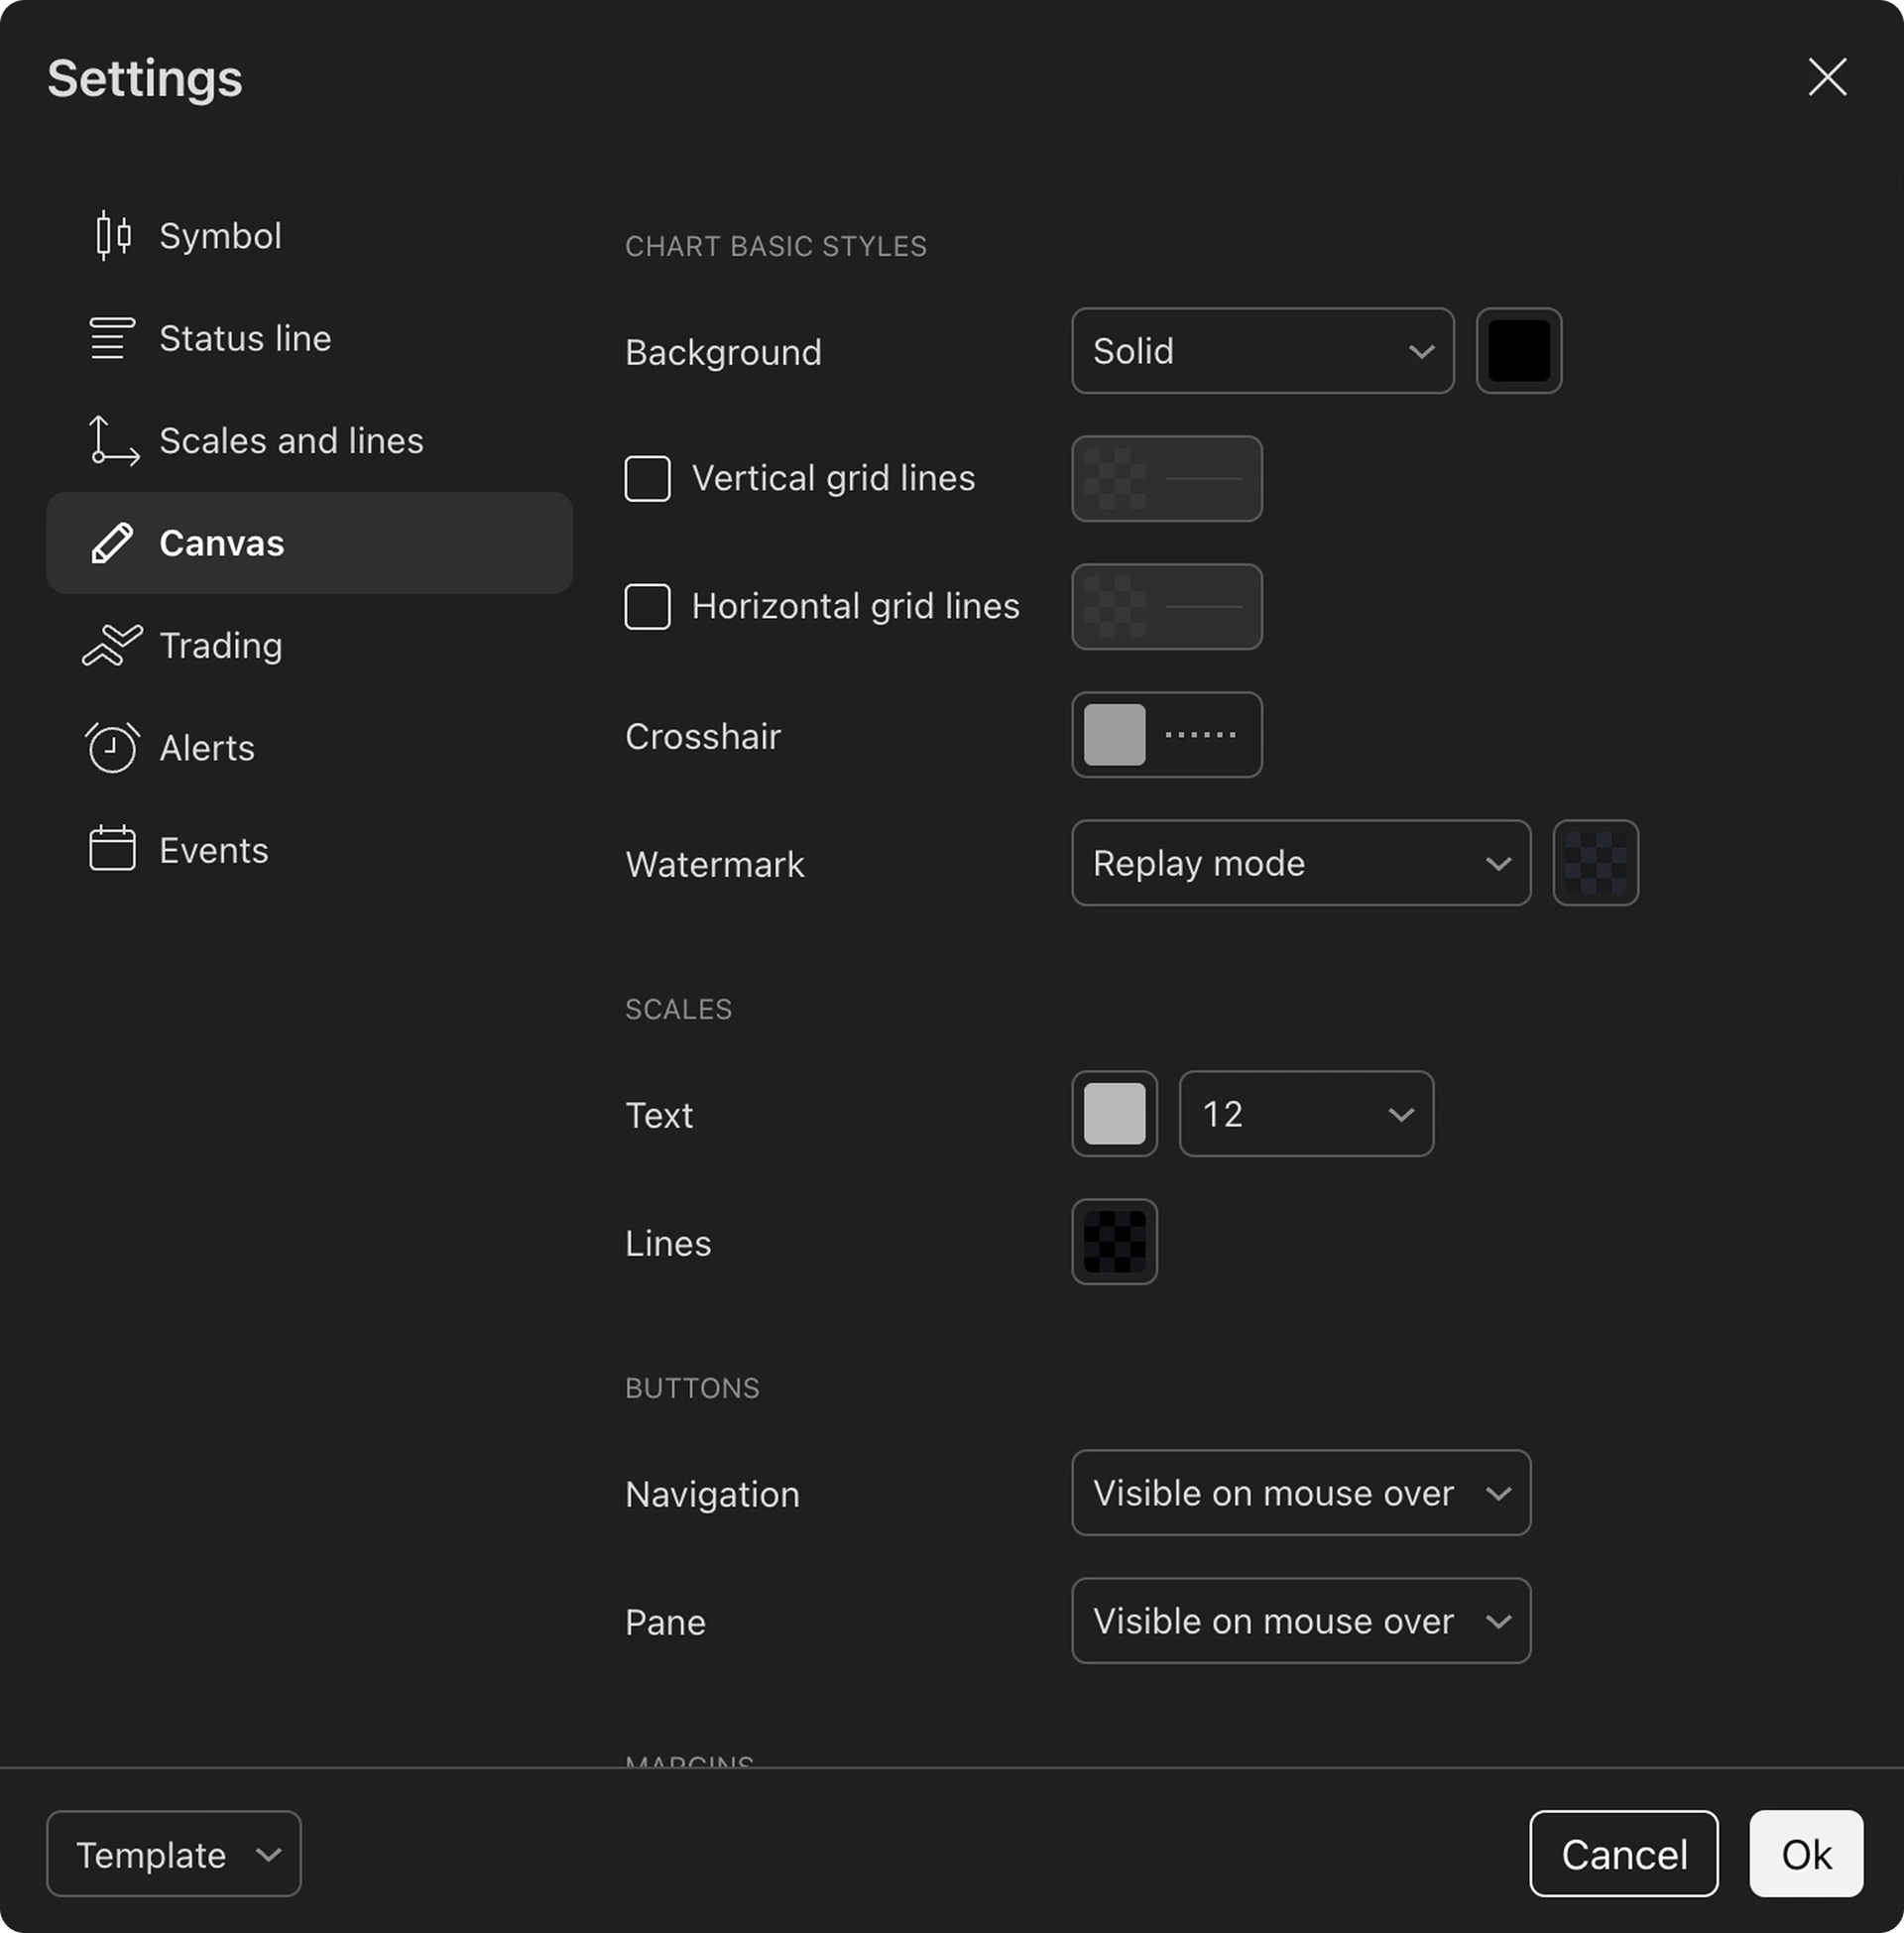
Customizable charts
You can select your preferred chart color, candles, lines and more. You can customize every inch, save layouts and use them again.
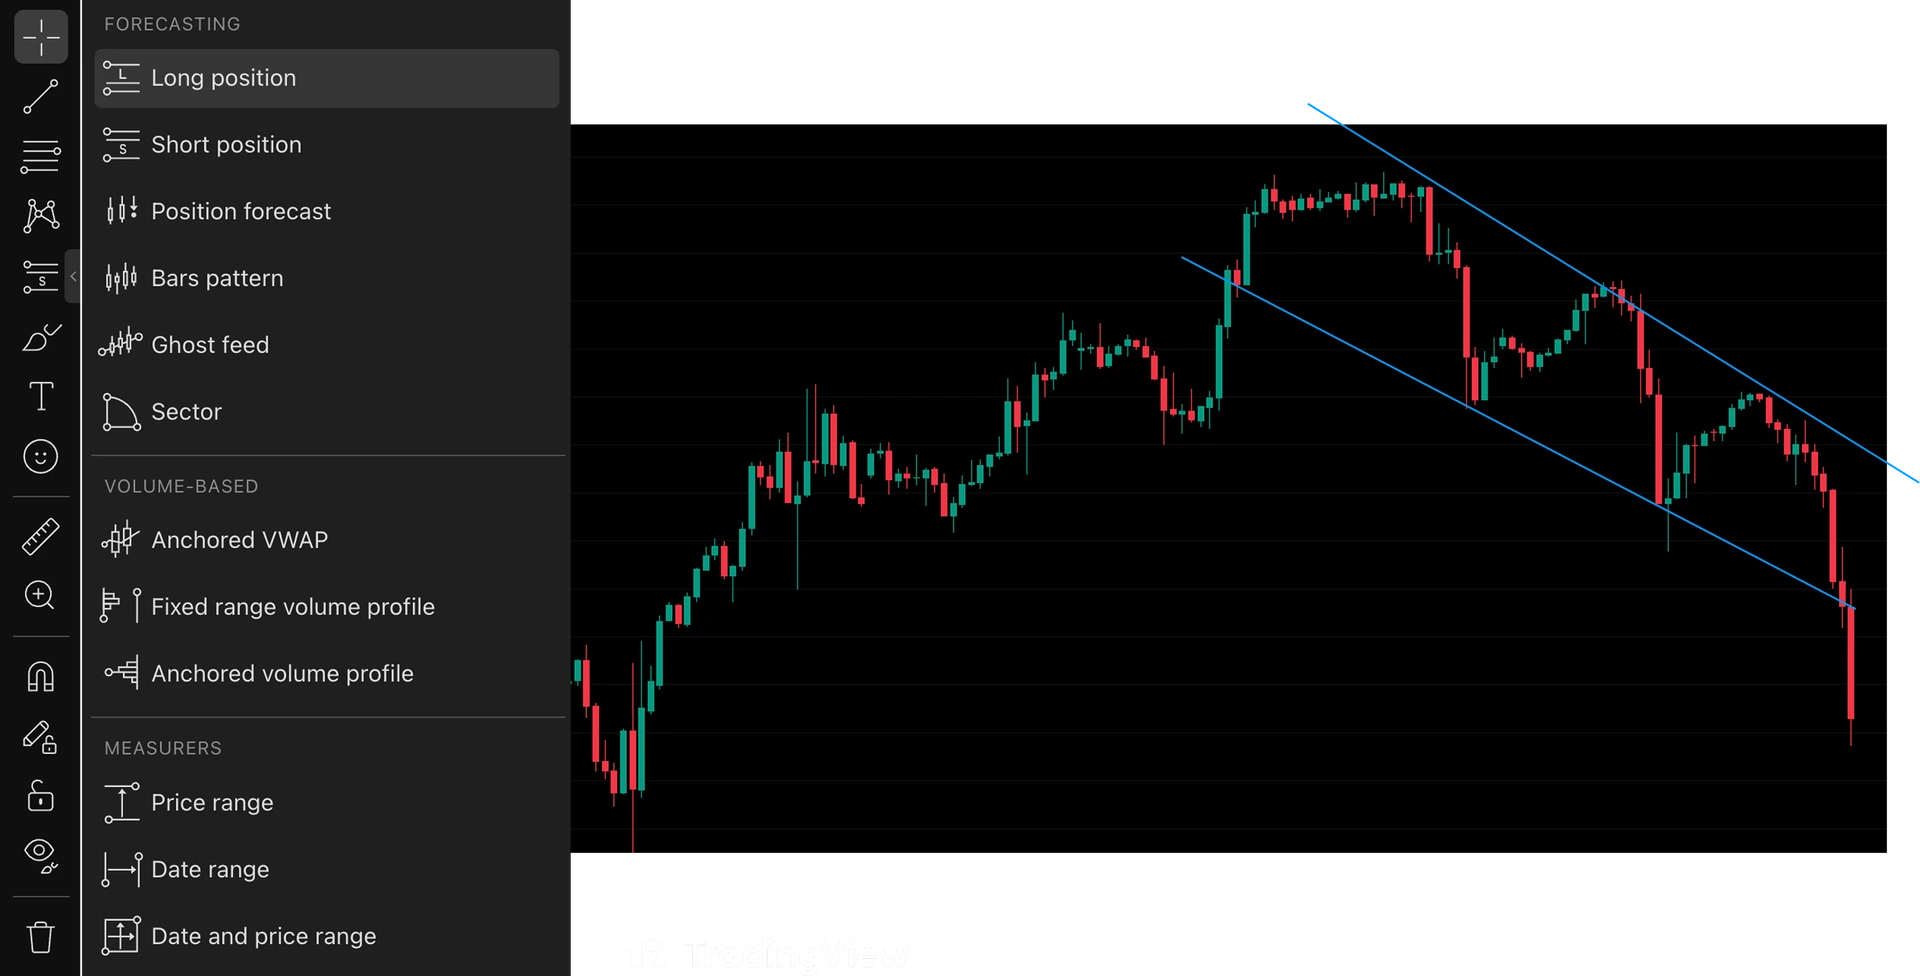
100+ drawing tools for precise analysis
Mark up your charts, measure price movements, and analyze every detail of your setups with a complete set of professional drawing tools provided by TradingView.
Stop guessing. Start proving your edge.Backtest your strategy. Build your confidence.
Frequently Asked Questions Answers for traders comparing backtesting software, chart replay tools, and strategy testers like Tradespad.
The best free backtesting software depends on your market and workflow, but most discretionary traders want realistic chart replay, clear trade management and a way to review results. Tradespad includes TradingView Charts backtesting on a free forever plan, so you can start free, replay history, place simulated trades and journal the session without paying upfront.
Trading backtesting software lets you replay historical price action and test a strategy before risking live capital. Instead of guessing whether a setup works, you simulate entries, exits, stop losses and take profits on past markets, then review the results. Tradespad combines chart-based backtesting with journaling and analytics so you can validate an edge and refine it in one workflow.
Yes. Tradespad backtesting runs on familiar TradingView charts so the experience feels close to live trading. You can replay bars, place trades, manage risk levels and review performance in a simulated environment. That makes it easier to practice execution and test discretionary setups without switching to a separate charting tool.
Chart replay (also called bar replay) walks price action forward candle by candle so you trade as if the market were live, without seeing future bars. You choose a session or date, advance the chart, take trades with stop loss and take profit, then analyze the outcome. Tradespad also includes Go to shortcuts for the next day or session so you can move through history faster while staying realistic.
Tradespad is the best free alternative to FXReplay for most discretionary traders who want chart replay and strategy practice without a paid-only replay tool. You get TradingView Charts backtesting, simulated trade management, journaling and analytics on a free forever plan. Start free if you want an FXReplay alternative that also connects backtesting results to your journal instead of leaving them in a separate replay app.
Yes. You can create a free Tradespad account and use backtesting on the free plan, then upgrade later if you need more capacity. Check current limits and paid options on the pricing page. Starting free makes it easy to compare Tradespad with other backtesting software before committing to a subscription.
Yes. Tradespad is built for multi-asset traders who want realistic chart replay across Forex, Futures, CFDs, crypto, indices and commodities. You can backtest on TradingView charts, manage stop loss and take profit, then review results in a trading journal and performance analytics. That makes it a strong option if you trade more than one market and want one backtesting workflow instead of separate tools per asset class.
You need enough history to cover different market conditions—trends, ranges, high volatility and quiet sessions—not just a short winning streak. For many discretionary strategies that means months to years of data per symbol. Tradespad offers extensive historical market data so you can replay long periods, jump between sessions and stress-test a setup before you trade it live.
Yes. After a backtesting session you can journal trades with notes, strategies and screenshots, then review entry and exit points on the chart. Filtered analytics help you see which symbols, sessions or setups actually perform. That turns backtesting into a feedback loop instead of a one-off simulation.
Use both when you can. Backtesting is faster for sampling many historical scenarios and checking whether a strategy had an edge in the past. Paper trading (forward testing) validates execution and psychology in current markets without risking capital. A practical workflow is to backtest in Tradespad first, refine rules, then paper trade the same playbook before going live.